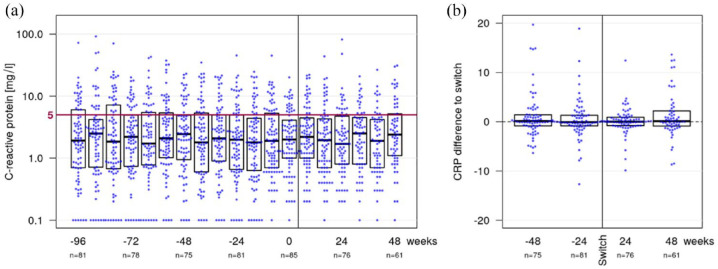
Figure 2.
The combined bee swarm and boxplot (a) shows CRP levels in all IBD patients during the observation period. The red line indicates the threshold value of 5 mg/l. All measured values ⩽5 mg/l are considered negative. The combined bee swarm and boxplot (b) shows the change in CRP compared to baseline for 48 weeks before and after the second switch.
CRP, C-reactive protein; IBD, inflammatory bowel disease.

