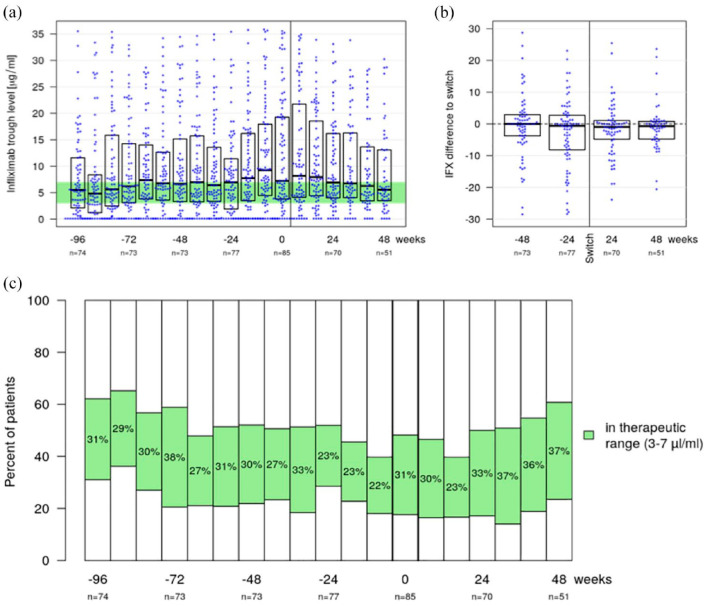
Figure 3.
Combined bee swarm and boxplot (a) displays TL for all IBD patients over the complete observation period. The optimal TL range was considered between 3 and 7 µg/ml and is highlighted (green). Combined bee swarm and boxplot (b) illustrates the change of TL compared to baseline for 48 weeks before and after the second switch. Stacked bar chart (c) shows the proportion of patients within the considered optimal TL range, where the white bars represent the proportion of patients with higher and lower TLs.
IBD, inflammatory bowel disease; TL, trough level.

