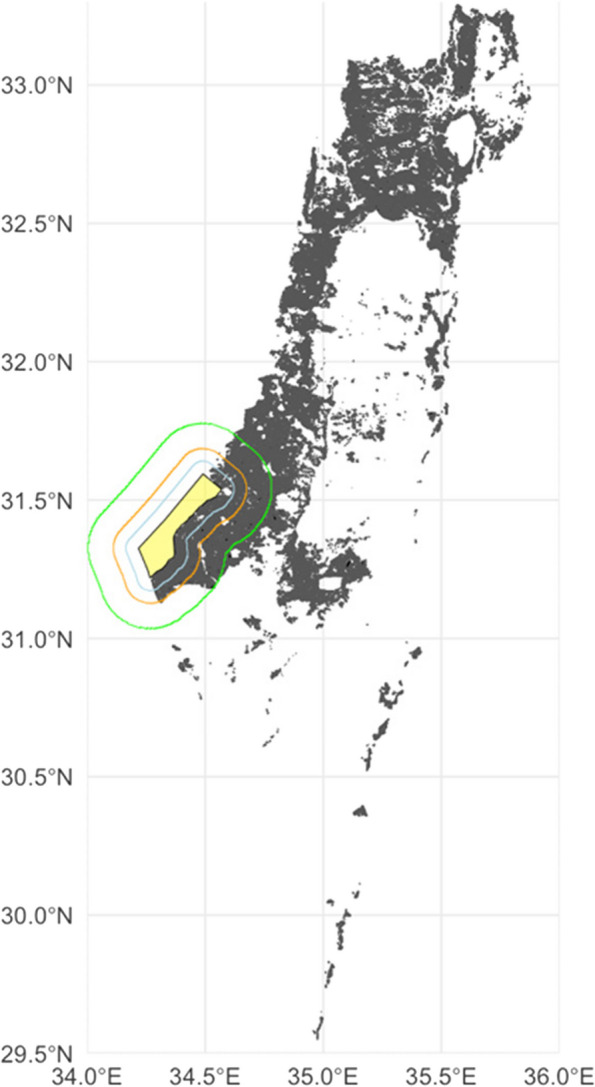
Fig. 1.

The spatial distribution of Israeli* agricultural plots in Israel and the West Bank in relation to their proximity to the Gaza Strip. The agricultural plots are represented by black polygons, with the Gaza Strip being a yellow polygon. Surrounding the Gaza Strip are concentric rings indicating varying distances from the border: a blue ring for the 5 km zone, an orange ring for the 10 km zone, and a green ring for the 20 km zone. *Israeli plots inside the West Bank were included as they are part of the current national agriculture production. That said, the authors do not intend for this map or analysis to be interpreted as a legal or political statement of ownership and/or control of the West Bank
