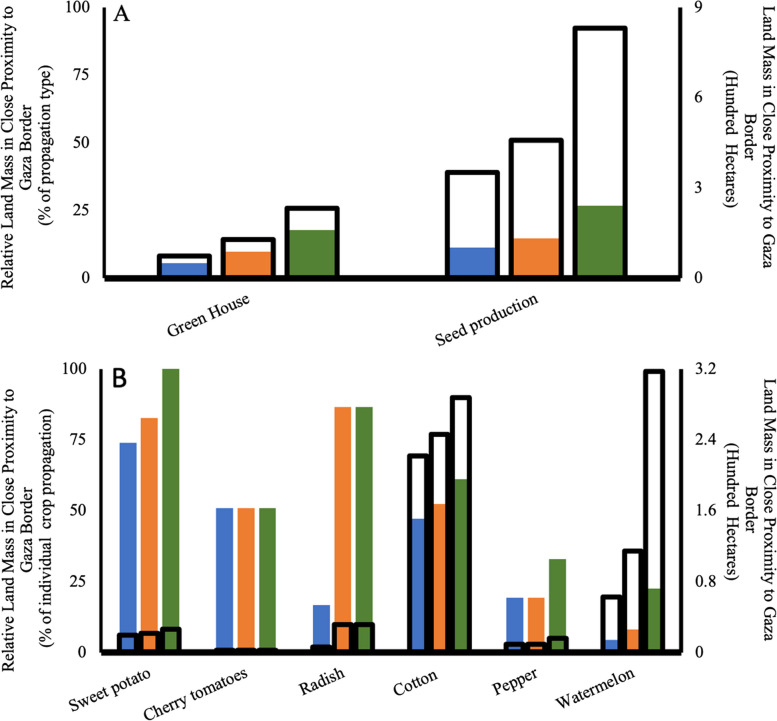
Fig. 5.
Contribution of Gaza Envelope region to propagation of crops. The contribution of the region to crop propagation is expressed as the relative land mass (colored columns) and the total land mass (clear columns with black borders), within three proximity zones to the Gaza border: ≤ 5 km (blue), ≤ 10 km (orange), and ≤ 20 km (green). The total contribution of the region to the greenhouse (vegetative) and seed (reproductive) propagation is shown in graph (A). The contribution to individual crops is shown (B) within three distance categories from the border: up to 5 km (blue), up to 10 km (orange), and up to 20 km (green)

