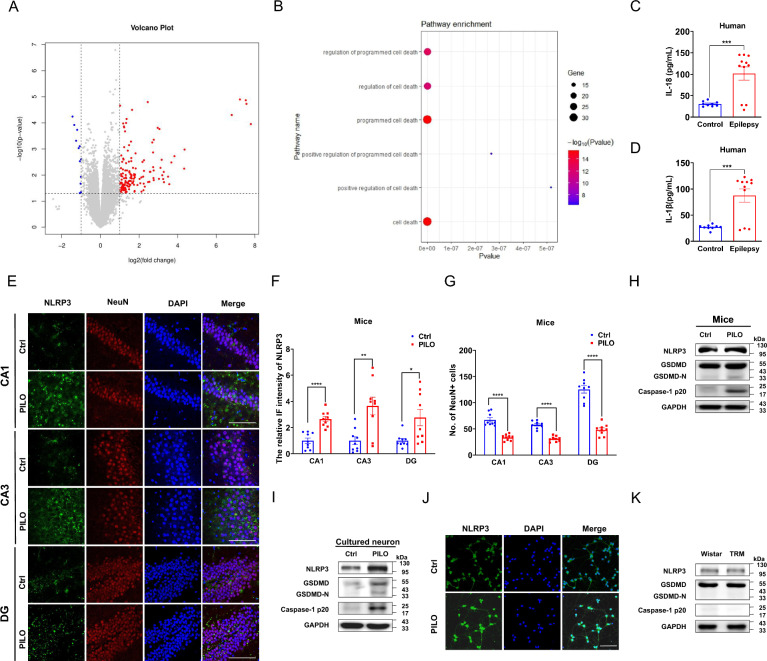
Fig. 1.
Pyroptosis was involved in SE but not in absence seizures A, B The volcano plot and GO enrichment analysis of the DEGs in mice treated with PILO compared with healthy C57BL/6 J controls (n = 5). The red dots represent up-regulated genes, while the blue dots represent down-regulated ones. C, D ELISA analysis of IL-18 (C) and IL-1β (D) in the serum of idiopathic epilepsy patients (n = 11) and healthy controls (n = 9). E–G Immunofluorescence analysis of NLRP3 (green) and NeuN (red) expression in hippocampus of PILO-treated C57BL/6 J mice (60 × lens), including the CA1, CA3 and DG regions (n = 9). Scale bar: 100 μm. DAPI (blue) was used to label nucleus. H, I The representative protein bands of NLRP3, GSDMD-N, and caspase-1 p20 in hippocampus of PILO-treated C57BL/6 J mice (n = 6) and cultured neurons treated with PILO for 24 h (n = 6). J Immunofluorescence analysis of NLRP3 (green) expression in cultured neurons (20 × lens) treated with PILO for 24 h (n = 6). Scale bar: 100 μm. DAPI (blue) was used to label nucleus. K The representative protein bands of NLRP3, GSDMD, and caspase-1 p20 of control Wistar and TRM rats (n = 6). Full scans of all the blots are in the Supplementary Note. *P < 0.05; ** P < 0.01; *** P < 0.001; **** P < 0.0001

