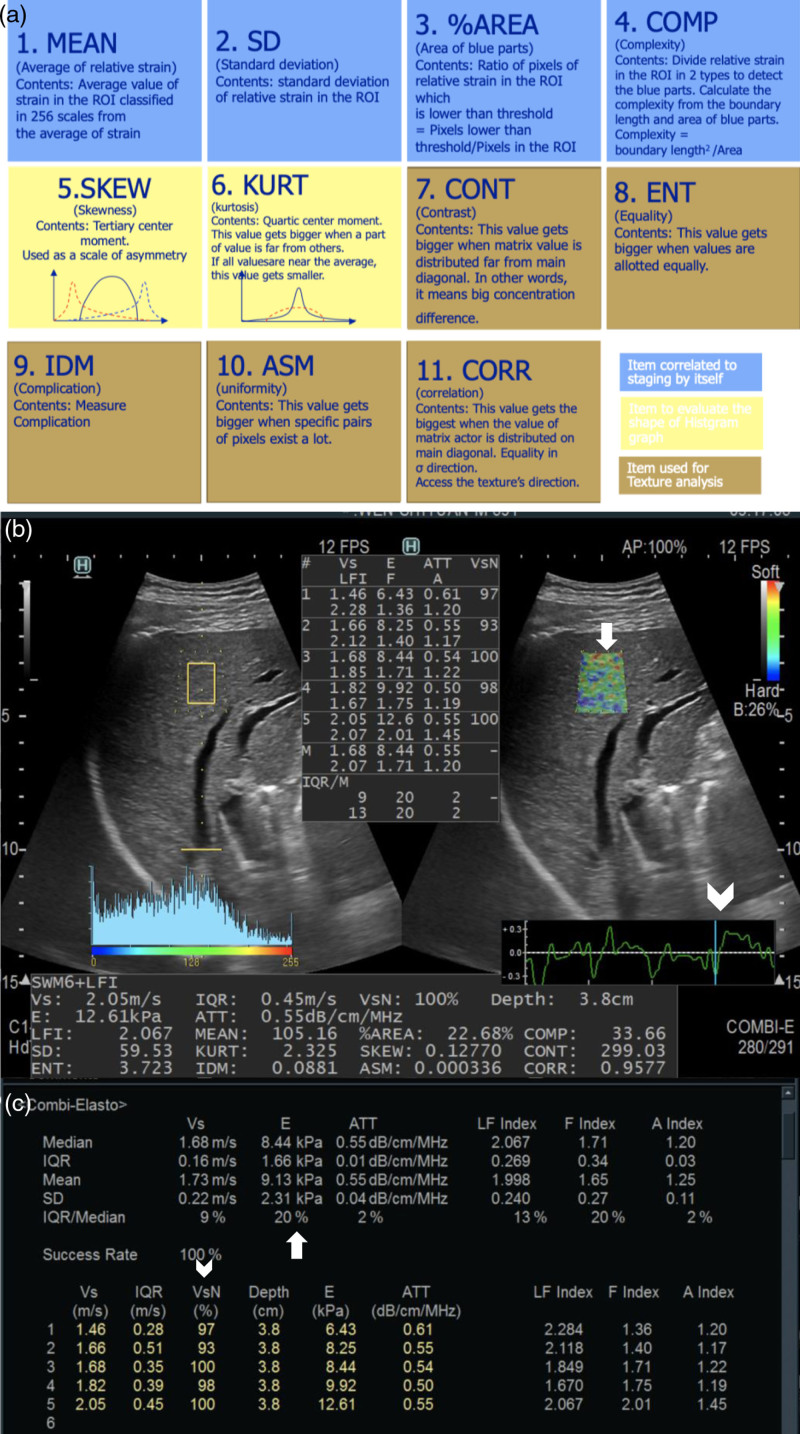
Fig. 2.
Combined elastography examination. (a) Eleven items of real-time tissue elastography images. (b) The measurement site was selected away from large vascular structures and ducts (with a diameter ≥3 mm) and at least 3 cm away from the lesions, preferably in the S5 and S8 of the liver if possible. ROI (arrow) was placed at a depth of 1–2 cm beneath the liver capsule. Regular periodic strain curve needs to select the trough frame (arrowhead) for analysis. (c) Qualified image, IQR/M for E ≤ 30% (arrow) and shear wave VsN (Vs efficacy rate) ≥ 60% (arrowhead). ATT, attenuation coefficient; IQR/M, interquartile range/median; ROI, region of interest.

