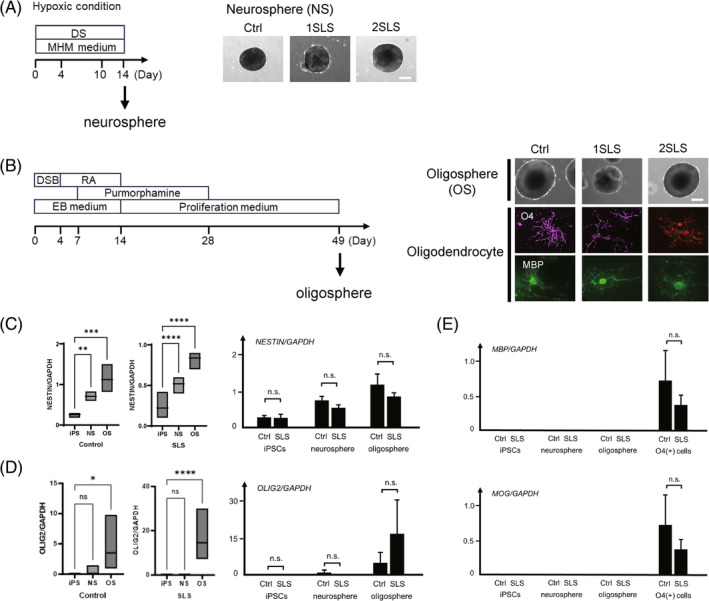
FIGURE 2.

Induction of oligospheres from iPSCs. (A) Schematic protocol of generation of neurospheres from iPSCs and morphology of the neurospheres. DS; dual SMAD inhibition, CHIR99021 and SB431542. Bar: 200 μm. (B) Schematic protocol of oligodendrocyte differentiation of iPSCs. On day 49, oligospheres were seeded and cultured for adhesion. After approximately 40 days, differentiation into O4‐positive and MBP‐positive oligodendrocytes was confirmed. DSB: Dorsomorphin, SB431542, and BIO (a GSK3 inhibitor); RA: Retinoic acid; EB, embryoid body. Bar: 200 μm. (C) (Left) Comparison of the NESTIN mRNA expression levels normalized to GAPDH expression in the iPSCs, neurospheres, and oligospheres by quantitative RT‐PCR. **p < 0.01, ***p < 0.001, ****p < 0.0001; Dunnett's multiple comparisons test. (Right) Comparison of the NESTIN mRNA expression levels normalized to the expression of GAPDH between the control and SLS iPSCs, neurospheres and oligospheres. n.s.: No significant; t‐test. (D) (Left) Comparison of the OLIG2 mRNA expression levels normalized to the GAPDH expression in the iPSCs, neurospheres, and oligospheres by quantitative RT‐PCR. ns; no significant, *p < 0.05, ****p < 0.0001; Dunnett's multiple comparisons test. (Right) Comparison of the OLIG2 mRNA expression levels normalized to the GAPDH expression between the control and SLS iPSCs, neurospheres, and oligospheres. ns.: Not significant; t‐test. (E) Comparison of the MAP and MOG mRNA expression levels normalized to the GAPDH expression in the iPSCs, neurospheres, oligospheres and O4 positive cells by quantitative RT‐PCR. (ns.: Not significant; t‐test.) In C, D and E., control: 201B7, WD39,119‐4F1 and 119‐4F2; SLS: 1SLS12, 1SLS20, 1SLS35, 1SLS36, 2SLS1, 2SLS2, 2SLS3, and 2SLS4.
