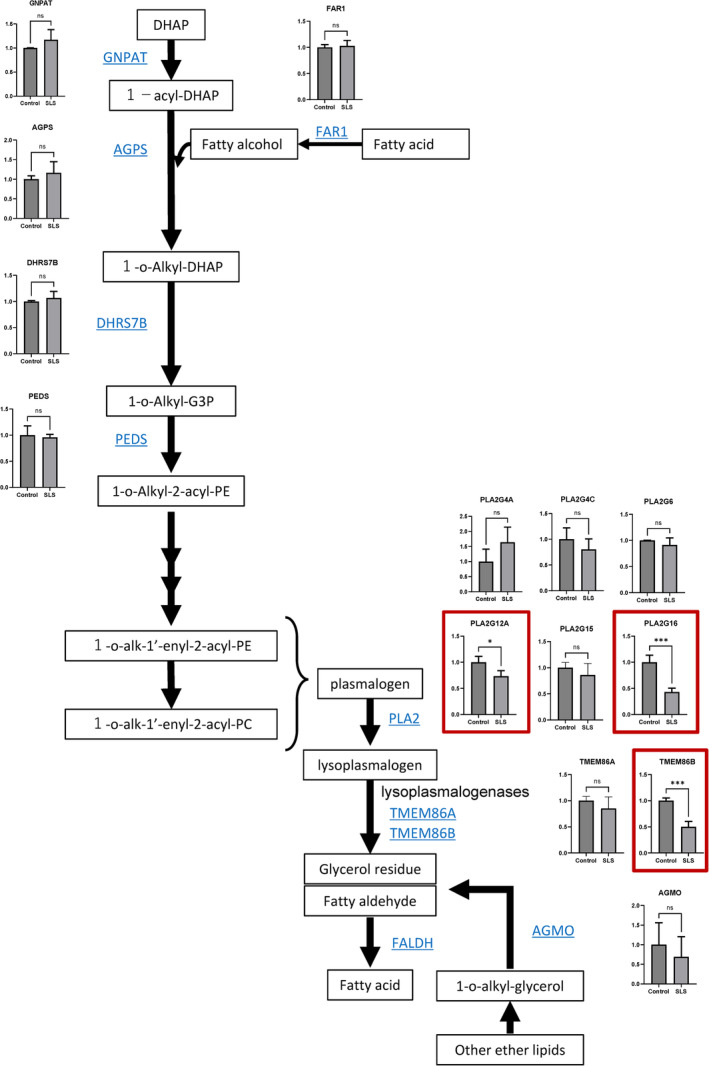
FIGURE 4.

Decreased gene expression of plasmalogen hydrolytic enzymes and lysoplasmalogenases involved in FALDH substrate production. Fold changes of the mRNA expressions of each enzyme in oligospheres derived from the control and SLS‐iPSCs measured by RNA‐seq. Y‐axis: Fold change of the gene expressions as compared with the control (control = 1). Control: 201B7 and WD39; SLS: 1SLS12, 1SLS35, 2SLS1, 2SLS2 and 2SLS3. ns: Not significant, *p < 0.05, **p < 0.01, ***p < 0.001; unpaired t‐test. Significant differences in gene expression between the control and SLS are marked with red squares.
