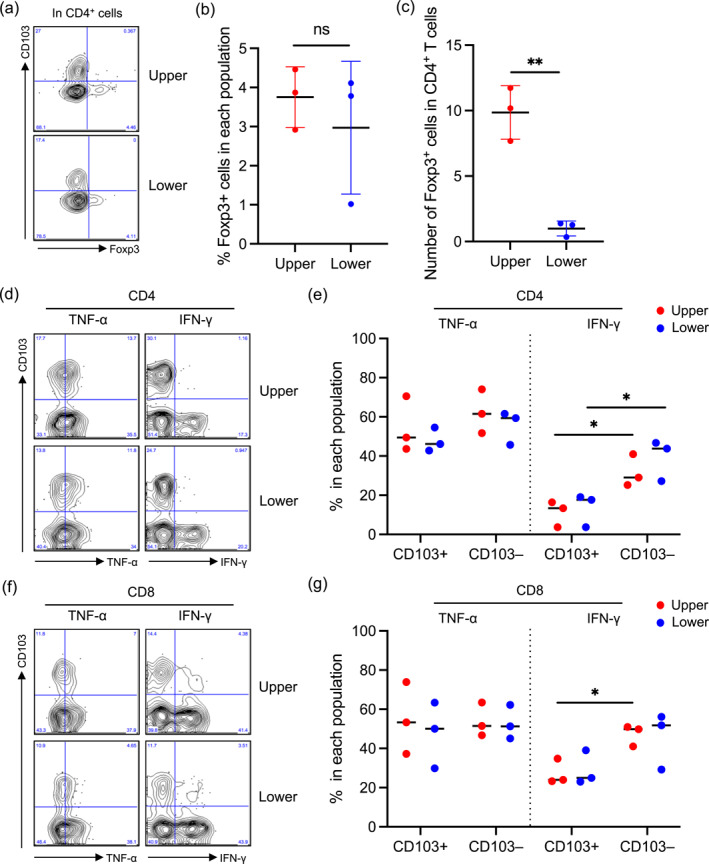
FIGURE 3.

(a) Representative forkhead box p3 (Foxp3) and CD103 expression in CD4+ T cells. (b) A summary of the percentage of Foxp3+ cells in CD4+ T cells (n = 3). (c) A summary of absolute Foxp3+ cell number per g of the upper and lower reticular dermis (n = 3). (d and f) Representative TNF‐α and IFN‐γ expression in CD4+ (d) and CD8+ (f) T cells. (e and g) A summary of the percentage of TNF‐α+ and IFN‐γ+ cells in CD103+ and CD103− T cells of CD4+ (d) and CD8+ (f) T cells. Comparisons between the upper and lower reticular dermis, and CD103+ and CD103− T cells were evaluated using Student's t‐test (two‐tailed); ns means not significant, and *p < 0.05, **p < 0.01, and ***p < 0.001. IFN‐γ, interferon‐gamma; TNF‐α, tumour necrosis factor‐alpha.
