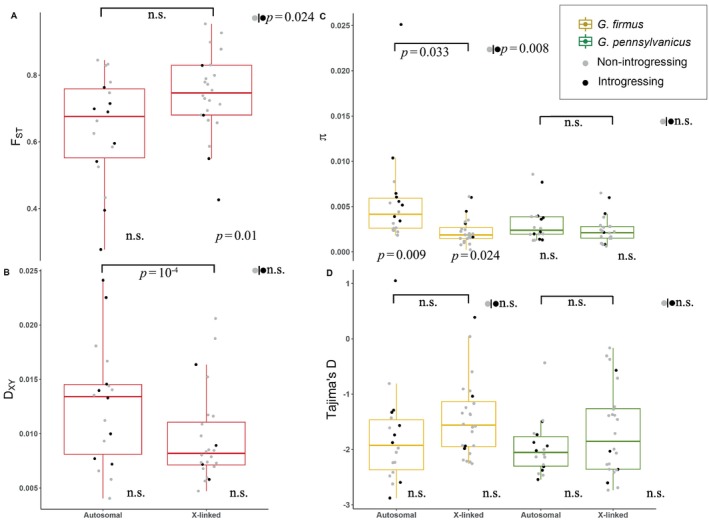
FIGURE 3.

Box plots and data points for F ST (A), D XY (B), π (C) and Tajima's D (D). Between species F ST and D XY comparisons (A, B) are shown in red; within species π and Tajima's D are shown in yellow for the beach cricket, Gryllus firmus , and green for the field cricket, G. pennsylvanicus . Data points for previously characterized introgressing loci are shown in black, and for non‐introgressing loci are shown in gray. Significant values for comparisons between autosomes and X chromosomes are shown on top; overall comparisons (without taking into account chromosomal linkage) between introgressing and non‐introgressing loci are shown to the right of each group, sidewise to gray and black circles; comparisons between introgression and non‐introgressing loci taking into account chromosomal linkage are shown on the bottom right of each box plot. For sample sizes refer to the text (Section 3).
