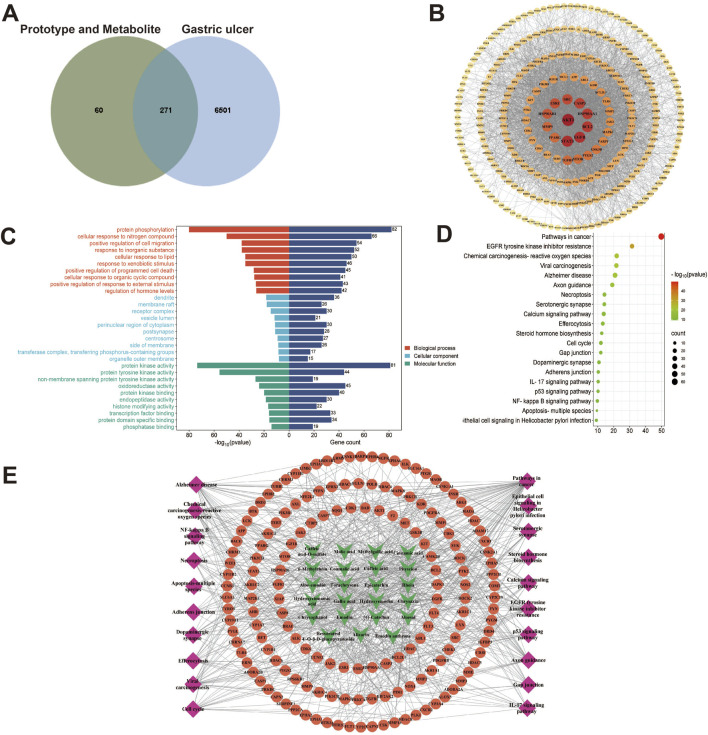
FIGURE 6.
Network analysis of three processed rhubarb products against GU. (A) Venn diagram of 271 intersection targets of rhubarb and GU; (B) PPI network exhibited the hub genes; (C) GO enrichment analysis; (D) KEGG pathway enrichment analysis; (E) Compound-target-pathway network. Green nodes refer to the active compounds, orange nodes refer to the targets, pink nodes refer to the top 20 KEGG pathway.

