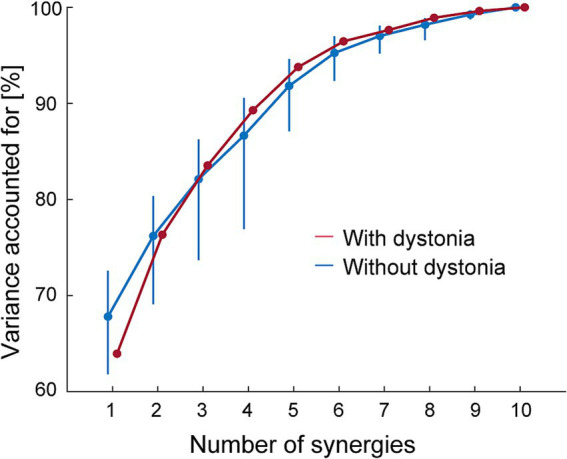
Figure 2.

The variance accounted for (VAF) as a function of the number of muscle synergies. The VAF for the EMG data with dystonia symptoms is shown in red, and that for the data without dystonia symptoms is shown in blue. The blue bars represent the upper and lower limits of the 95% bootstrapping confidence intervals (CIs) of the VAF for each number of muscle synergies in the data without dystonia symptoms.
