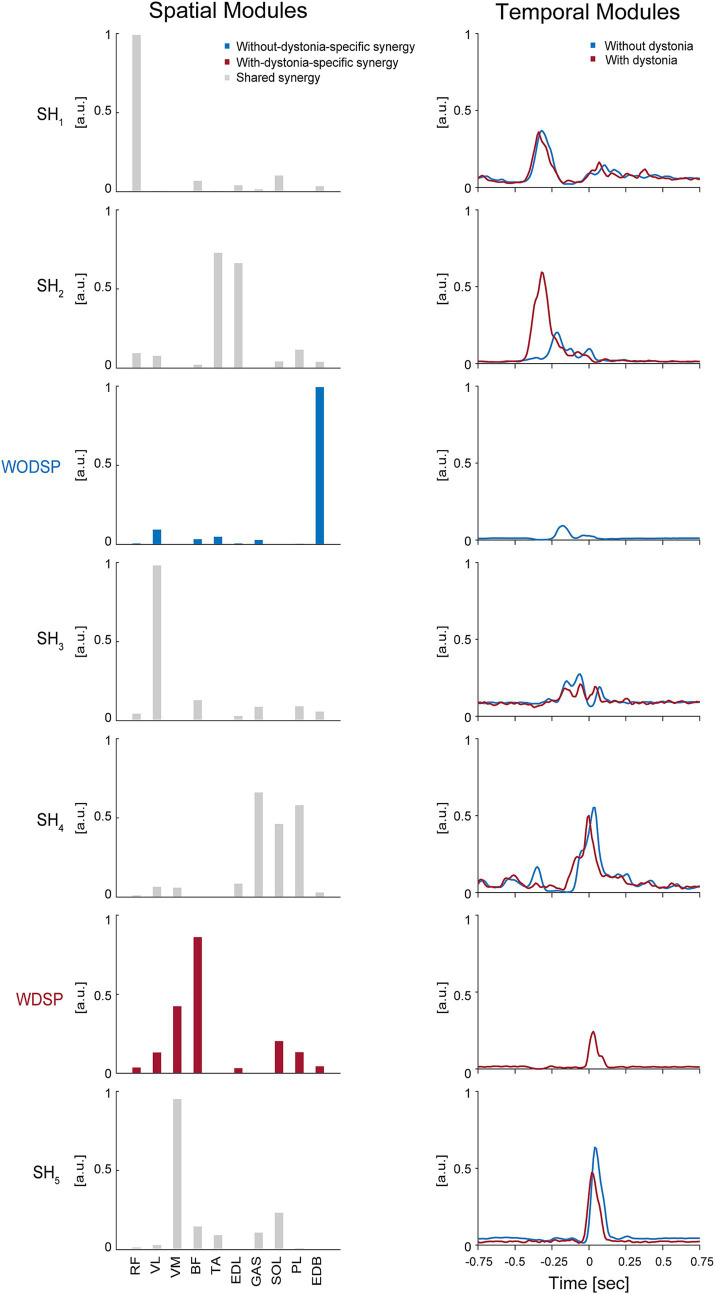
Figure 4.
Shared muscle synergies between the data with and without dystonia and specific muscle synergies for each dataset. The spatial and temporal modules of shared and specific muscle synergies are shown in the left and right panels, respectively. In the left panels, the bars represent muscle weights of rectus femoris (RF), vastus lateralis (VL), vastus medialis (VM), biceps femoris (BF), tibialis anterior (TA), extensor digitorum longus (EDL), soleus (SOL), gastrocnemius (GAS), peroneus longus (PL), and extensor digitorum brevis (EDB), respectively, extracted from the non-negative matrix factorization (NMF). The grey bars represent the shared spatial modules between the data with and without dystonia (SH1–5). The blue bars represent the without-dystonia-specific synergy (WODSP). The red bars represent the with-dystonia-specific synergy (WDSP). In the right panels, the activation coefficients in the NMF, or the temporal modules of muscle synergy, are shown 0.75 s before and after the metronome sound. The red lines indicate the temporal modules for the data with dystonia, while the blue lines indicate those for the data without dystonia.

