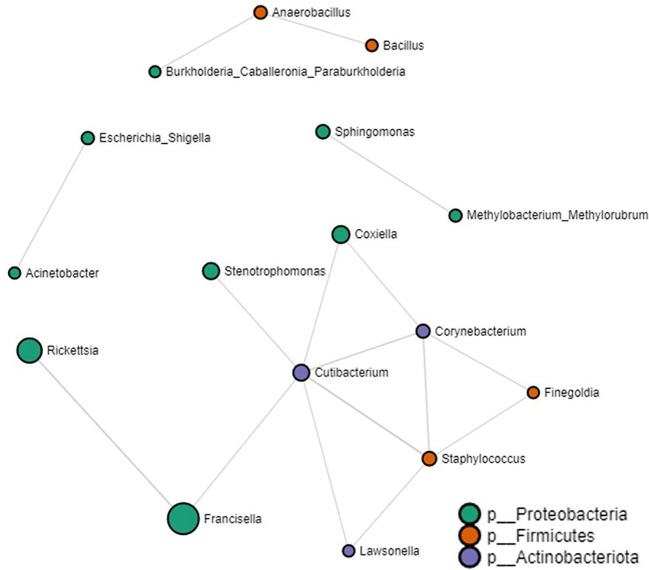
Figure 5.
Correlation network analysis on all tick genera. Correlation network generated using the SparCC algorithm. Correlation network with nodes representing taxa at the family level and edges representing correlations between taxa pairs. Node size correlates with the number of interactions in which a taxon is involved. The color-coded legend shows the bacterial phyla.

