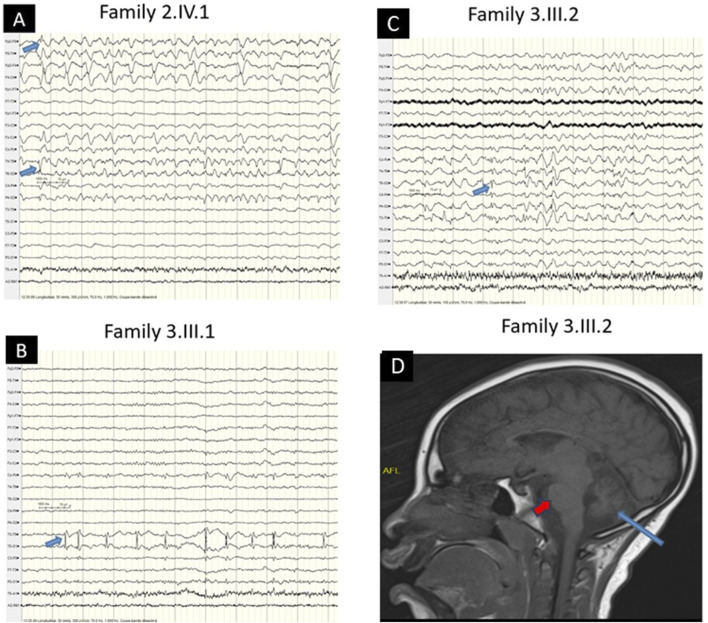
FIGURE 2.
EEG and MRI Characteristics (A) EEG showing right temporal spike waves with left low-voltage background activity (blue arrow) in the older patient (Family 2, IV.1). (B) EEG showing left temporal spike waves (blue arrow) in the patient (Family 3, III.1). (C) EEG showing focal (right temporoparietal) spike waves (blue arrow) in the patient (Family 3, III.2). (D) Brain MRI showing cerebellar atrophy (blue arrow) sparing the pons (red arrow) (Family 3, III.2).

