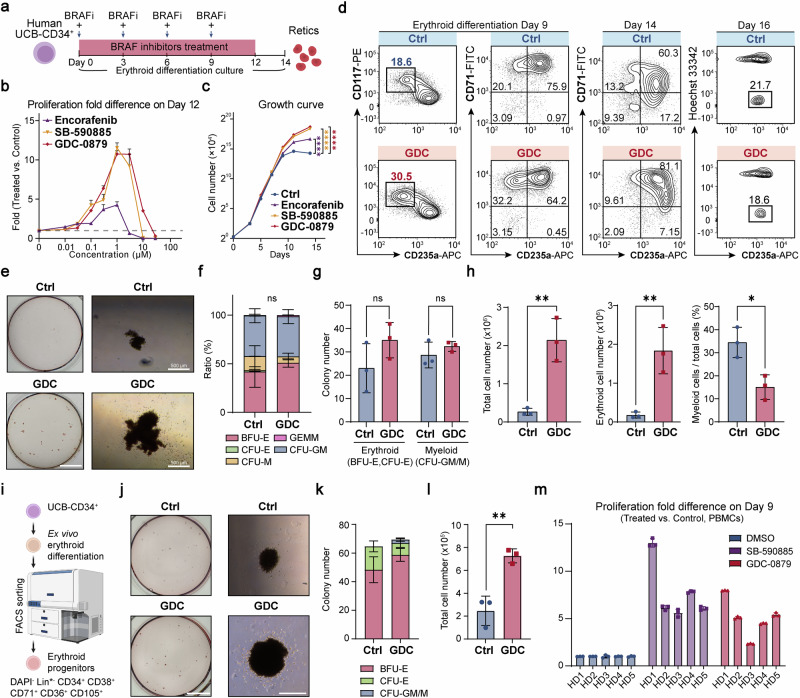
Fig. 1.
BRAF inhibitors promoted the self-renewal of primary erythroid progenitors in vitro. a Drug treatment workflow in UCB-CD34+-derived in vitro erythroid differentiation culture system. “+” indicates BRAFi treatment in conjunction with a change of medium. b The drug dose-response assay for UCB-CD34+-derived erythroid culture was conducted, with total cell numbers counted on Day 12. The graph illustrates the fold difference in proliferation between the GDC-treated and control (DMSO) groups on Day 12. The dashed line indicates the fold change for the control group. c The growth curve of UCB-CD34+-derived erythroid culture over 14 days in vitro, starting from 1.2 × 10⁴ cells on Day 0. The asterisks represent statistical differences obtained through two-way ANOVA test in cell number between the treatment groups and the control (DMSO) group. d Representative flow cytometry analysis of UCB-CD34+-derived erythroid cells in the control group (DMSO) and the GDC-0879-treated group on differentiation Day 9 (Left), Day 14 (Middle) and Day 16 (treated from Day 0–9) (Right). CD117 (c-kit), receptor for stem cell factor; CD71, transferrin receptor; CD235a (Glycophorin A), erythroid marker. CD235a+Hoechst- cells are regarded as enucleated reticulocytes. e Representative images of colony forming assay (CFA) of 300 UCB-hCD34+ cells seeded in Methocult H4435 and cultured for 14 days. (Left) Whole-plate view; (Right) BFU-E colony. Scale bar = 10 mm (Left), 500 μm (Right). f, g Colony number and ratio statics of panel (e). There was no significant difference between the two groups in the proportion of either colony in panel (f). h Quantification of total cell numbers, erythroid cell numbers and the myeloid lineage ratio of cells washed from Methocult medium on Day 14 in the CFA of panel (e). Erythroid cells are identified as CD235a+, and myeloid cells as CD11b+. i UCB-CD34+ cells were differentiated for 5 days, after which erythroid progenitor cells were sorted and seeded in Methocult medium. (Bottom) Strategy for sorting erythroid progenitor cells. Lin* includes CD2, CD3, CD14, CD16, CD19, CD56, CD235a, CD45RA, CD123, CD7, CD10, CD90, CD135, and CD41a. j Representative images of colony forming assay of 100 erythroid progenitor cells seeded in Methocult H4435 and cultured for 14 days. (Left) Whole-plate view; (Right) BFU-E colony. Scale bar = 10 mm (Left), 500 μm (Right). k, l Colony number and quantification of cell number of cells washed from Methocult medium on Day 14 in the CFA of panel (j). m Fold change in cell number of PBMCs from 5 healthy donors (HDs) cultured in an erythroid differentiation system on Day 9. Unless otherwise noted, all experiments used control (DMSO), SB-590885 at 1 μM, GDC-0879 at 2 μM, and Encorafenib at 0.5 μM. BFU-E burst forming unit-erythroid, CFU-E colony forming unit-erythroid, CFU-M colony forming unit-monocyte, CFU-GM colony forming unit-granulocyte macrophage, GEMM Granulocytic-erythrocytic-megakaryocytic-macrophage. Error bars represent the mean ± SD from three biological replicates. A two-tailed unpaired Student’s t-test was performed for the statistical comparison between two groups (ns, P > 0.05; *P < 0.05; **P < 0.01; ***P < 0.001; ****P < 0.0001)

