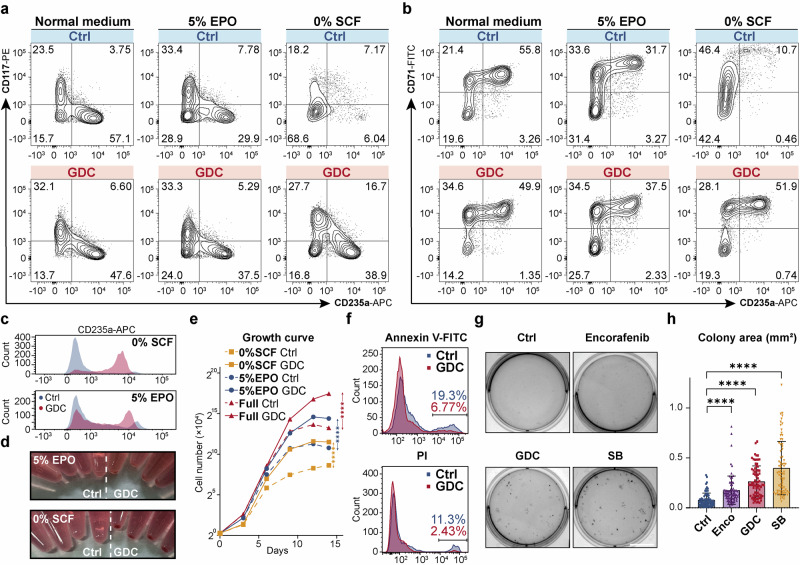
Fig. 2.
BRAF inhibitors attenuated ineffective erythropoiesis under cytokine-restricted conditions. a, b Flow cytometry analysis of UCB-CD34+-derived erythroid cells in the control group and GDC-0879-treated group on differentiation Day 9 under normal and specified conditions (5% EPO [0.15 IU/mL EPO]; 0% SCF [0 ng/mL SCF]), using cell surface markers CD117, CD235a, and CD71, CD235a. Concentrations of other cytokines were kept unchanged as usual. c Histograms showing the differences in CD235a levels between GDC-treated and control erythroid cells under different cytokine-restricted conditions on Day 14. d Cell pellets of UCB-CD34+ derived erythroid cells cultured under different cytokine-restricted conditions on Day 14, with each group containing equivalent cell numbers in this image. e Growth curves of UCB-CD34+-derived erythroid cells, starting from 1.2 × 10⁴ cells, treated with 2 μM GDC-0879 under the indicated conditions from Day 0 to Day 14. The asterisks indicate statistical differences in cell number between the treatment groups and the control group, as determined by a two-way ANOVA under the specified culture conditions. n = 3. f Flow cytometry analysis of UCB-CD34+-derived erythroid cells treated with DMSO or 2 μM GDC-0879 for 5 days and then subjected to cytokine deprivation (EPO, SCF and IL3) for 48 h, showing Annexin V-FITC (top) and PI (bottom) staining. g Whole-plate view of CFA with 200 UCB-CD34+ cells seeded in EPO-only Methocult H4430 and incubated under BRAFi (Encorafenib, GDC, or SB)-treated or control conditions for 14 days. Scale bar = 10 mm. h Statistical analysis of the area of 75 individual erythroid colonies in panel (g) on Day 14. Unless otherwise noted, all experiments used control (DMSO), SB-590885 at 1 μM, GDC-0879 at 2 μM, and Encorafenib at 0.5 μM. Error bars represent the mean ± SD. A two-tailed unpaired Student’s t-test was performed for the statistical comparison between two groups (****P < 0.0001)

