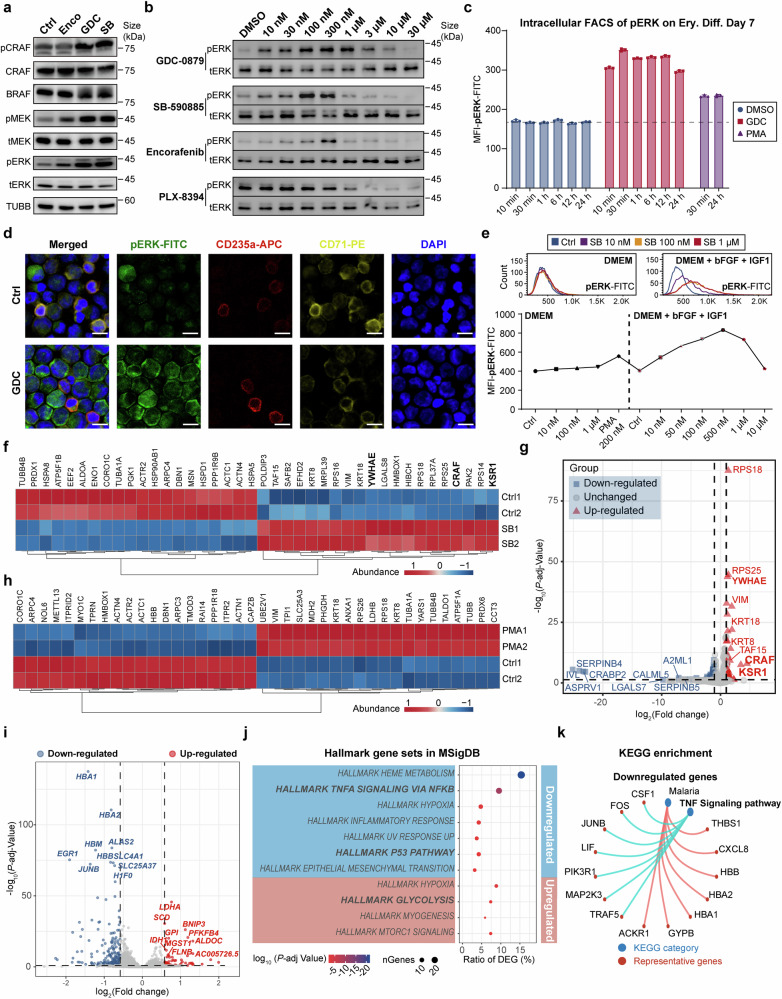
Fig. 3.
BRAF inhibitor-induced amplification of the ERK/MAPK cascade in erythroid progenitor cells was dependent on CRAF and the active extracellular signaling. a Immunoblotting of MAPK signaling cascade proteins in UCB-CD34+-derived erythroblasts cultured under normal conditions and treated on Day 9 with Encorafenib (0.5 μM), GDC-0879 (2 μM), or SB-590885 (0.5 μM) for 30 min. b Levels of phosphorylated and total ERK proteins in UCB-CD34+-derived erythroblasts on Day 9, cultured under normal conditions and treated with different BRAF inhibitors for 30 min. c Median fluorescence intensity (MFI) statistics of intracellular flow cytometry of phosphorylated-ERK-FITC of 7-day differentiated erythroid cells from UCB-CD34+ treated with 2 μM GDC or 200 nM PMA for different time period. The dashed line indicates the fluorescence intensity of the negative control. n = 3. d Immunofluorescence staining of phosphorylated-ERK-FITC, erythroid markers CD235a-APC and CD71-PE, and DAPI of 7-day differentiated erythroid cells from UCB-CD34+ treated for 30 min. Scale bar = 10 μm. e Representative intracellular flow cytometry histograms and MFI statistics of phosphorylated-ERK-FITC in 293 T cells under different culture system treated in different chemicals and concentration for 30 min. DMEM: DMEM with 10% FBS; bFGF (basic fibroblast growth factor), 50 ng/mL; IGF1 (insulin-like growth factor 1), 50 ng/mL. n = 3. f Heatmap of the top 20 proteins that were most significantly upregulated and downregulated respectively by 3 × Flag-BRAF interaction proteins in the control group (DMSO) and the 30-minute 1 μM SB-treated group, identified through flag-affinity immunoprecipitation-mass spectrometry (IP-MS) of 3 × Flag-BRAF in BRAF-overexpressing K562 cells. The components of the RAF protein dimer complex are bolded. cutoff, p < 0.05. g Volcano plot of 3 × Flag-BRAF interacting proteins in IP-MS of SB-treated and control groups in K562 cells. cutoff: p-adj < 0.05, foldchange > 2. The components of the RAF protein dimer complex are bolded. h Heatmap of the top 20 proteins that were most significantly upregulated and downregulated respectively by 3 × Flag-BRAF interaction proteins in the control group (DMSO) and the 30-minute 200 nM PMA-treated group, identified through Flag-affinity IP-MS of 3 × Flag-BRAF in BRAF-overexpressing K562 cells. cutoff, p < 0.01. i Volcano plot of the differentially expressed genes (DEGs) between CD71+ erythroid progenitor cells treated with 2 μM GDC for 72 h and control (DMSO) groups. DEGs were defined with a cutoff fold change > 1.5, FDR (false discovery rate) < 0.1. j The Molecular Signatures Database (MSigDB) hallmark gene sets enrichment analysis for DEGs between CD71+ erythroid progenitor cells treated with 2 μM GDC for 72 h and the control group. k Representative KEGG enrichment analysis of downregulated DEGs in the GDC-treated group compared to the control group. Error bars represent the mean ± SD

