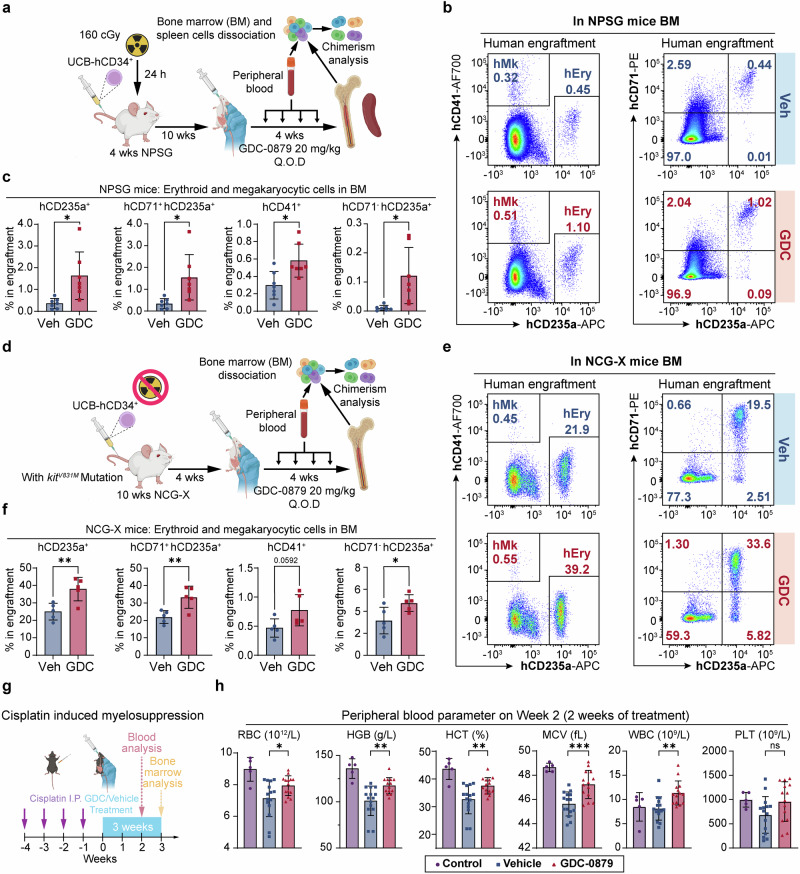
Fig. 6.
BRAF inhibitors promoted erythroid and megakaryocytic engraftment in human hematopoietic reconstitution, and alleviated anemia in vivo. a Schematic diagram of the human hematopoietic reconstitution model in irradiated NPSG mice. Q.O.D., every other day. b Representative flow cytometry analysis of the proportion of erythroid cells and megakaryocytes in human engraftment and erythroid differentiation in the bone marrow of NPSG mice 14 weeks after transplantation. c Statistics on the proportion of erythroid cells and megakaryocytes in human engraftment in NPSG mice bone marrow 14 weeks after transplantation. n = 7 in each group in NPSG model. Each dot represents one mouse. d Schematic diagram of the human hematopoietic reconstitution model in irradiated-free NCG-X mice (e). Representative flow cytometry analysis of the proportion of erythroid cells and megakaryocytes in human engraftment and erythroid differentiation in the bone marrow of NCG-X mice 8 weeks after transplantation. f Statistics on the proportion of erythroid cells and megakaryocytes in human engraftment in the bone marrow of NCG-X mice 8 weeks after transplantation. n = 5 in each group in NCG-X mice model. Each dot represents one mouse. g Schematic diagram of GDC administration in the cisplatin-induced myelosuppression model. Purple arrows indicate cisplatin induction; blue shaded box indicates duration of treatments (vehicle or GDC). Blood cell parameters were measured in Week 2 and bone marrow cell composition was analyzed in Week 3 through flow cytometry. Each dot represents one mouse. h Red blood cell parameters were measured from mouse peripheral blood after 2 weeks of treatment. For the control group, n = 5; for the vehicle group, n = 15; for the GDC group, n = 14. Each dot represents one mouse. Error bars represent the mean ± SD. A two-tailed unpaired Student’s t-test was performed for the statistical comparison between two groups (ns, P > 0.05; *P < 0.05; **P < 0.01; ***P < 0.001)

