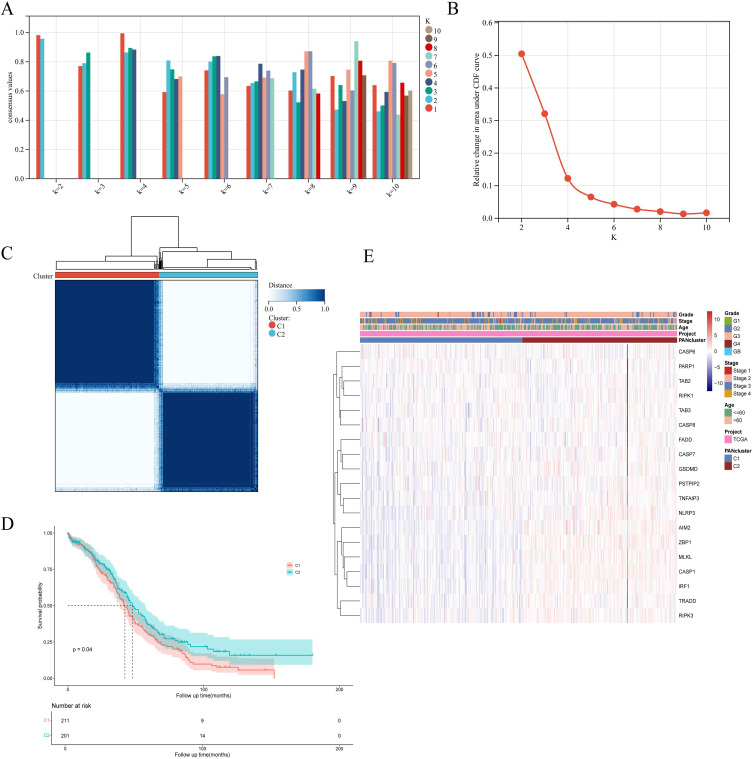
Figure 3.
19 PRGs identified two PAN clusters with different prognoses in OC samples. (A and B) Evaluate the average consistency within the cluster and evaluate the area under the CDF curve when K takes different values. (C) OC samples were grouped by consensus clustering (k=2). (D) Kaplan-Meier survival analysis of PAN cluster groups. (E) The heatmap displays the correlation among PANclusters, clinical characteristics of OC samples, and PRG expression.

