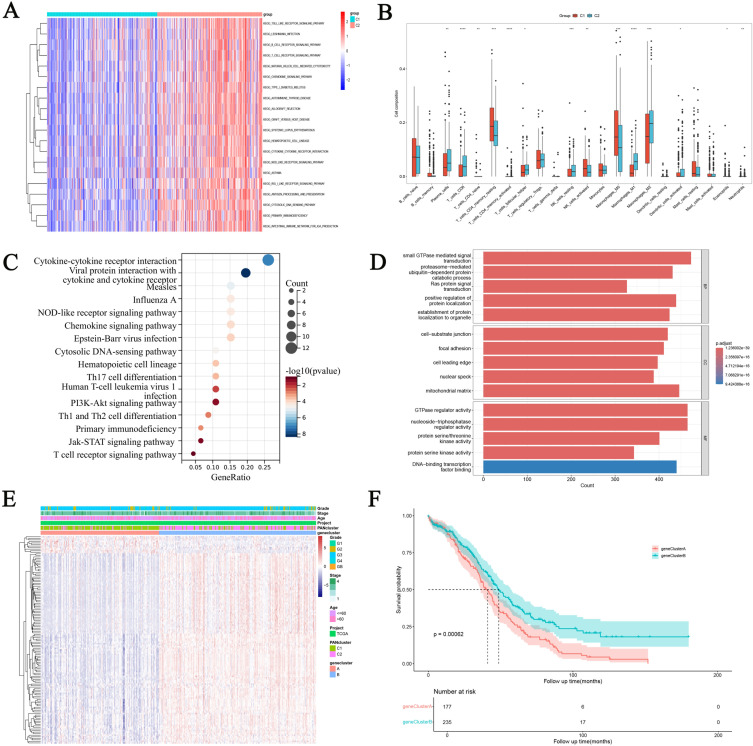
Figure 4.
Identification of Differential expression of genes (DEGs) in PAN clusters and construction of gene-clusters. (A) Differences in GSEA enrichment between PANclusters. (B) Analysis of immune cell infiltration between PANclusters. *p < 0.05; **p < 0.01; ***p < 0.001;****p<0.0001. (C and D) KEGG and GO analyze of DEGs in PAN clusters. (E) Heatmap showing the relationship between PRGs expression and gene cluster, PANcluster, and clinical information. (F) Prognostic differences between gene clusters.

