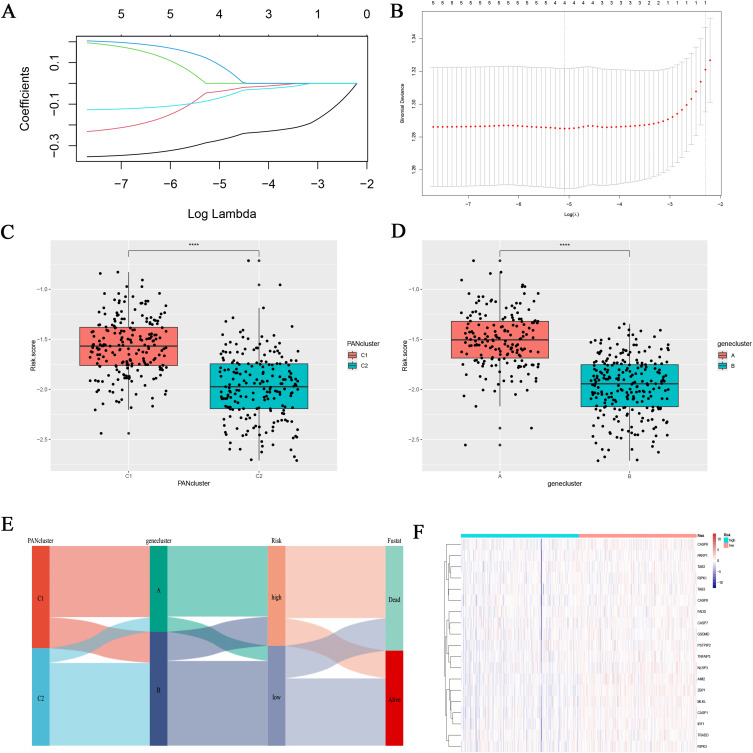
Figure 5.
Developing a Risk Scoring Model Based on DEGs. (A and B) Survival related genes were identified through Lasso regression analysis. The correlation between risk score and PAN cluster and gene cluster. The correlation between risk score and PAN cluster (C) and gene cluster (D). ****p<0.0001. (E) The Sankey plot shows the distribution of PAN cluster, gene-cluster, risk score group, and survival outcomes. (F) PRGs expression in different risk scoring groups.

