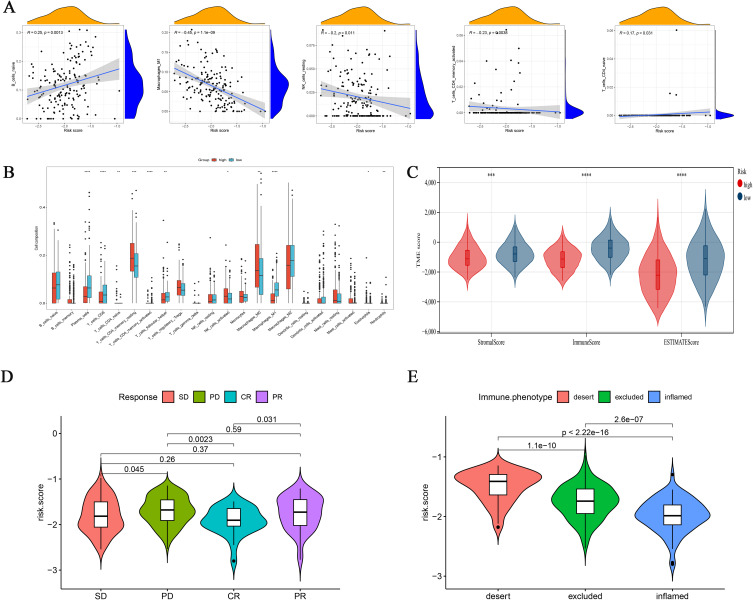
Figure 7.
Integrated assessment of the immune cell landscape of risk models. (A) Association between risk score and immune cell type. (B) Immune cell infiltration between different risk model groups. (C) Immuno-score, Stromal-score, and ESTIMATE-score between different risk models. *p < 0.05; **p < 0.01; ***p < 0.001; ****p<0.0001. (D) In the IMvigor210 cohort, there were variations in risk scores across different clinical responses to anti-PD-L1 treatment. (E) Differences in risk scores for various immunophenotypes in the IMvigor210 cohort.

