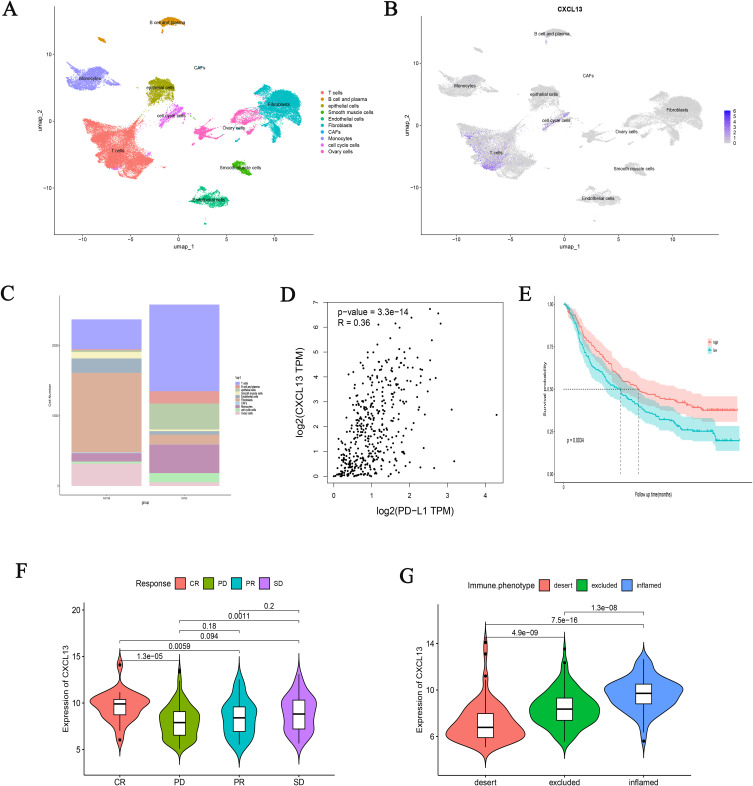
Figure 11.
The relationship between CXCL13 and the efficacy of immunotherapy. UMAP visualization of the major cell subsets of ovarian cancer (A) and the distribution of CXCL13 in different cells (B) in single-cell analysis of the GSE149614 database. (C) The proportion of different cell populations in ovarian cancer and normal tissue.(D) The relationship between CXCL13 and PD-L1.(E) The survival curve shows the prognostic differences caused by different expressions of CXCL13. Different CXCL13 expression groups lead to different clinical responses (F) and immune infiltration (G) differences in anti-PD-L1 therapy.

