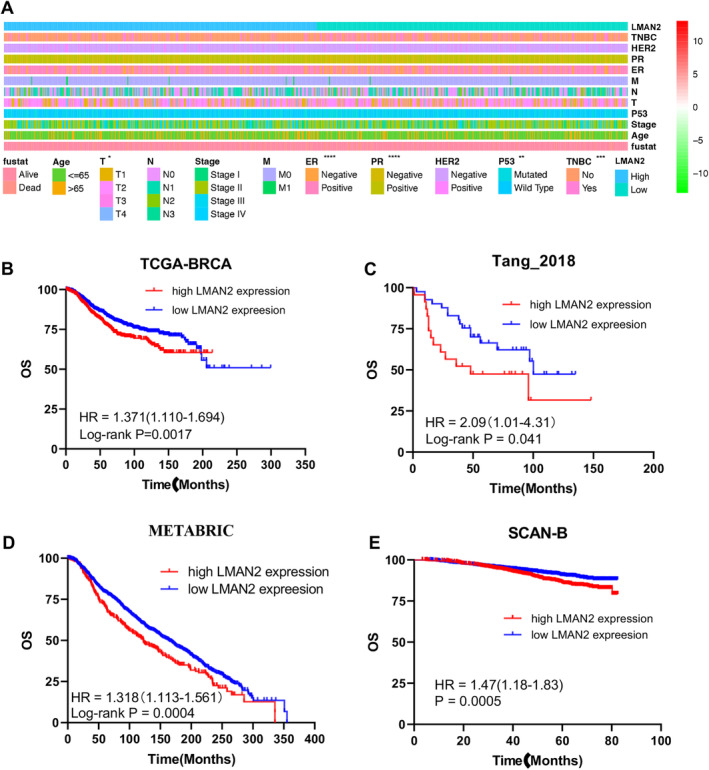
FIGURE 2.

Relationship between clinical features and LMAN2 expression. (A) The strip chart shows the differences in the distribution of clinical features between the high‐ and low‐LMAN2 expression groups. (B–E) Kaplan–Meier analysis of the association between LMAN2 expression and overall survival in BC patients in the TCGA, Tang_2018, METABRIC, and SCAN‐B cohorts. The data are shown as the means ± SEMs of at least three experiments. *p < 0.05, **p < 0.01, ***p < 0.001, ****p < 0.0001.
