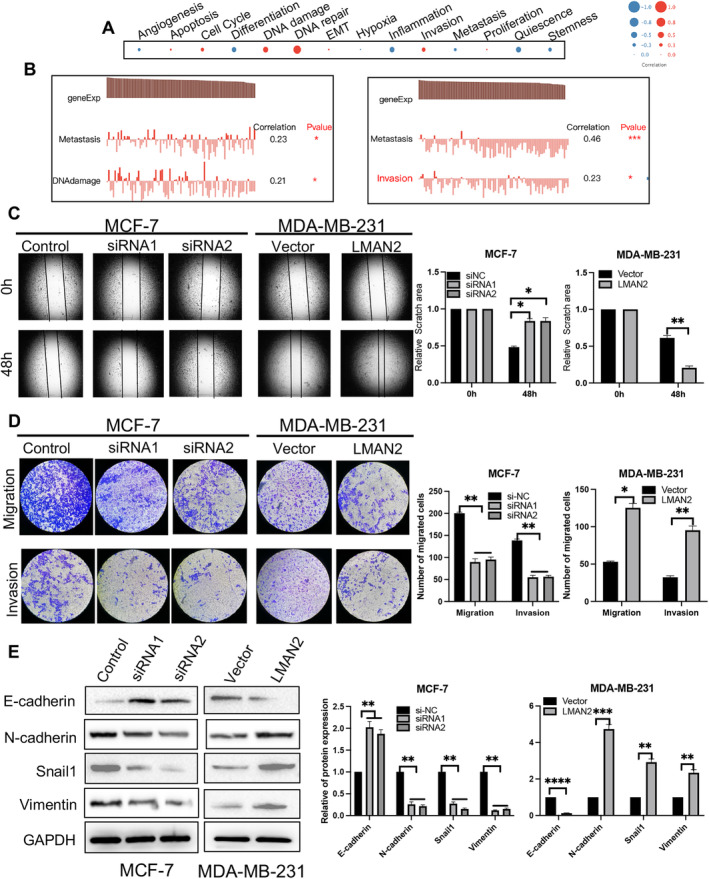
FIGURE 4.

LMAN2 promotes cell mobility. (A) Functional analysis of the correlation between LMAN2 and BC patients using CancerSEA. The bubble size represents the average correlation strength; red indicates a positive correlation, and blue indicates a negative correlation. (B) Detailed functional correlations in the PDX model. (C–D) Results of the wound healing and Transwell chamber assays for assessing migration and invasion abilities. The migratory and invasive cells were stained with Hoechst. (E) Western blot analysis of the expression levels of EMT‐associated proteins (E‐cadherin, N‐cadherin, Snail1, and vimentin). The results of quantitative analysis of cell migration, invasion, and EMT are shown in the right panel. The data are shown as the mean ± SEM of at least three experiments. *p < 0.05, **p < 0.01, ***p < 0.001, ****p < 0.0001.
