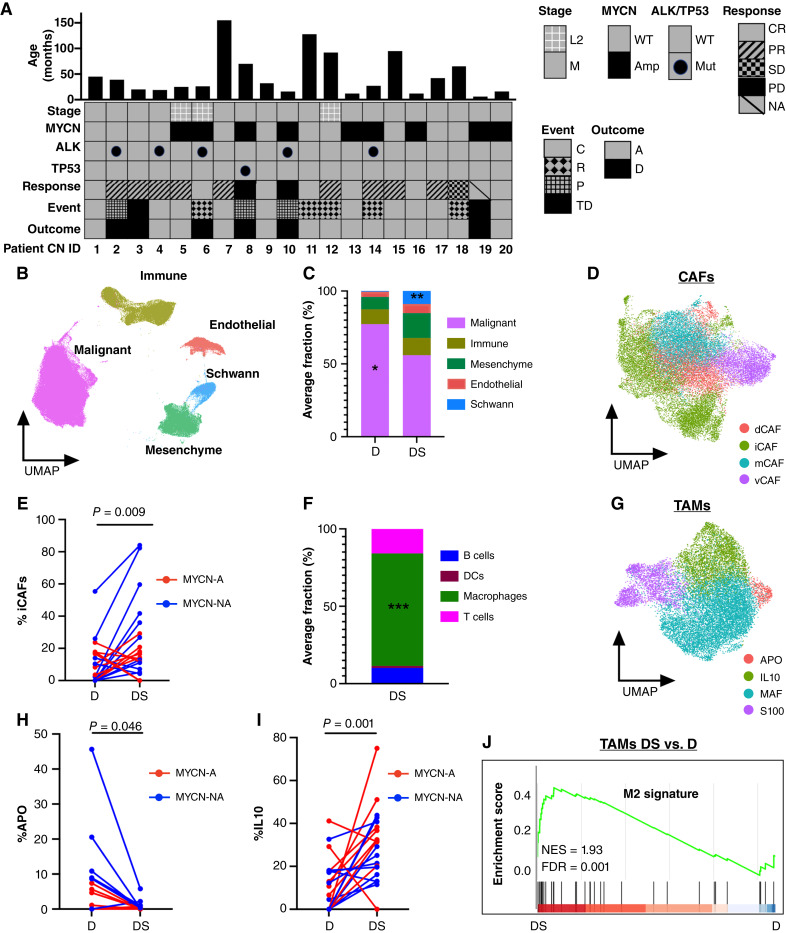
Figure 1.
Chemotherapy remodels the cellular composition of neuroblastoma tumors. A, Patients characteristics of a paired matched cohort of 20 patients with high-risk neuroblastoma at diagnosis and surgical resection. Response was determined at the end of induction therapy, typically after 1–2 additional cycles of chemotherapy following definitive surgery. B, Uniform Manifold Approximation and Projection for Dimension (UMAP) of 248,591 nuclei integrated from diagnostic and surgical specimens from 20 patients with high-risk neuroblastoma showing the main cellular components of tumors. C, Stacked bar plot of average percent of cell type at diagnosis and definitive surgery. Malignant cells showed a statistically significant decrease (P = 0.013; paired Wilcoxon test) whereas Schwann cells demonstrated a statistically significant increase (P = 0.006; paired Wilcoxon test) at definitive surgery. D, UMAP of CAFs annotated according to recently identified CAF subtypes (30). E, Connected pairs plot showing the percent of relative iCAFs at diagnosis and definitive surgery in 20 tumor pairs. Lines are colored by MYCN amplification status. F, Stacked bar plot of average percent of immune cell types at definitive surgery (P = 2.96e−05; Wilcoxon test). G, UMAP of TAMs annotated according to recently identified neuroblastoma TAM subtypes (17). H, Connected pairs plot showing the percent of relative APO TAMs (APO) at diagnosis and definitive surgery in 20 tumor pairs. I, Connected pairs plot showing the percent of relative IL10 TAMs (iL10) at diagnosis and definitive surgery in 20 tumor pairs. J, Gene set enrichment analysis (GSEA) analysis of DEGs between TAMs at definitive surgery and diagnosis shows enrichment for M2 signatures (15). *, P < 0.05; **, P < 0.01; ***, P < 0.001. A, laive; AMP, amplified (red) ; C, censor; CR, complete remission; D, death; DS, definitive surgery; D, diagnosis; M, metastatic; MUT, mutated; NES, normalized enrichment score; NA; not amplified (blue); NA, not available (patient died before end of induction response evaluation); NS, not significant; P, progression; PD, progressive disease; PR, partial response; R, relapse; SD, stable disease; TD, toxic death; WT, wildtype.

