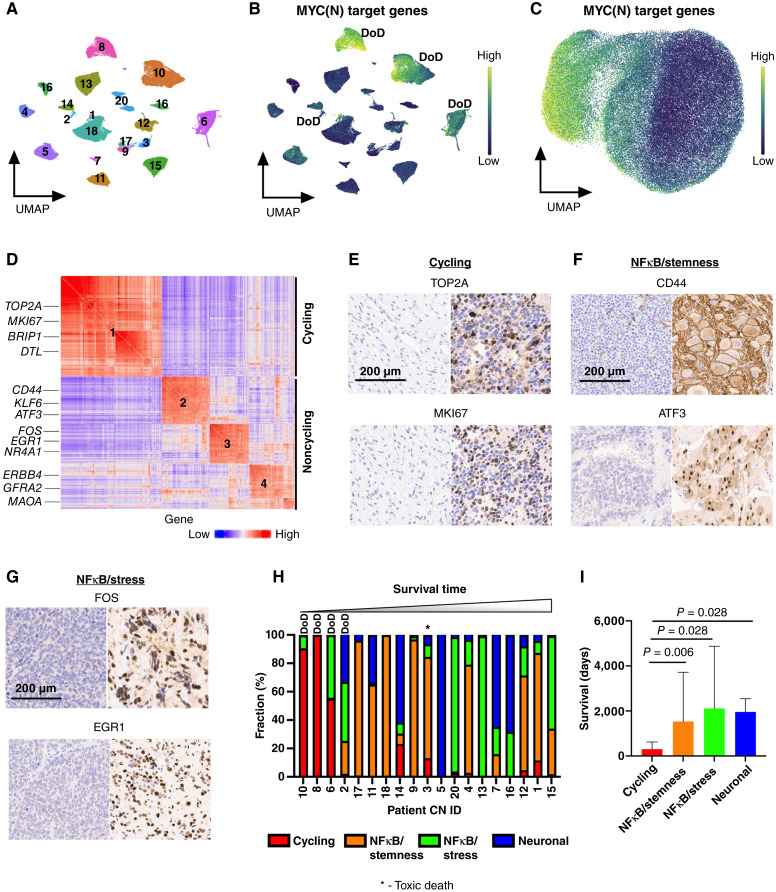
Figure 2.
Pathway-based clustering identifies four persister cell subtypes. A, UMAP of 86,901 persister nuclei from 38 surgical resection specimens. Specimens from the same patient cluster together. Numbers correspond to patient CN sample ID. B, UMAP showing the score of MYC(N) target genes [MYC(N) activity] for each persister nucleus. Yellow, high score; dark blue, low score. Three of four patients with high MYC(N) activity at time of definitive surgery died of their disease, with two patients experiencing progressive disease (CN8 and CN10), and one experiencing relapse (CN6). DoD, dead of disease. C, UMAP showing 86,901 persister nuclei clustered according to the pathway-based clustering algorithm using the top 9 most autocorrelated pathways (C > 0.5; FDR < 0.01; see “Methods” for definition of C), here with MYC(N) target genes pathway score shown. Yellow – high score, dark blue – low score. D, Gene to gene (426 genes × 426 genes) correlation heatmap. Rows and columns corresponding to the genes in the meta-modules identified by Hotspot. Red, high correlation; blue, low correlation. Meta-modules were annotated using cell-cycle and pathway enrichment analyses and are numbered as follows: 1–cycling, 2–NFκB/stemness, 3– NFκB/stress, and 4–neuronal. Genes enriched in each meta-module are depicted on the left. E, IHC staining for TOP2A and MKI67, two markers of cycling persister meta-module (#1), of a tumor with low frequency of cycling persister cells at time of definite surgery (left) and tumor with high frequency of cycling persister cells obtained from patient CN8 (right). F, IHC staining for CD44 and ATF3, two markers of the NFκB/stemness meta-module (#2), of a tumor with high NFκB/stemness cells at time of definite surgery obtained from patient CN9. G, IHC staining for FOS and EGR1, two markers of the NFκB/stress meta-module (#3), of a tumor with high NFκB/stress cells at time of definite surgery obtained from patient CN13. H, Bar plot of persister subtypes fraction of 19 surgical specimens (CN19 had no malignant nuclei identified at the time of definitive surgery) ordered in increasing order of the corresponding patients’ survival times. I, Bar plot of patients’ survival times with corresponding tumors assigned to the most abundant persister subtypes. The malignant nuclei of definitive surgery specimens from each patient were decomposed into persister subtypes as in H, and each tumor was classified according to its most abundant persister subtype. The patients’ survival times were then assigned to the corresponding tumors.

