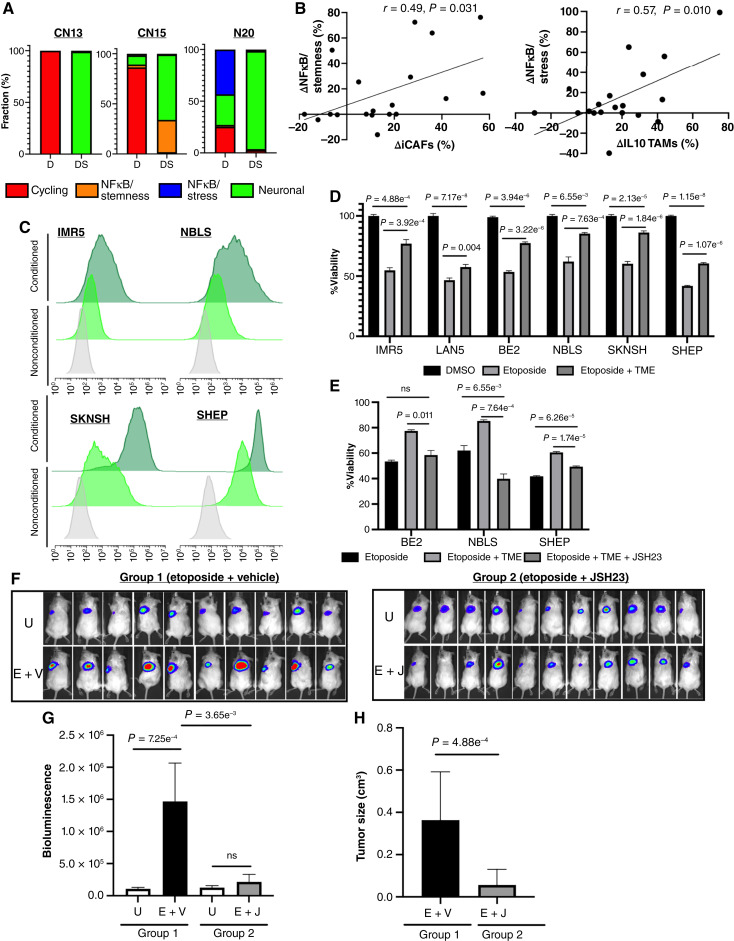
Figure 6.
Multiple signals trigger NFκB activation in persister cells. A, Bar plots of persister subtypes percent of three tumors obtained from patients (CN13, CN15, and CN20) at diagnosis and definitive surgery. B, Scatter plots showing the relative changes in percentage of NFκB/stemness from diagnosis to definitive surgery (left) and relative changes in percentage of NFκB/stress (right) from diagnosis to definitive surgery as a function of the relative changes in iCAFs and IL10 TAMs percentages from diagnosis to definitive surgery, respectively. C, Flow cytometry histograms for the GFP (FITC) reporter under NFκB consensus sequence in MYCN-amplified or overexpressing neuroblastoma cell lines (IMR5 and NBLS; top) and MYCN-non-amplified neuroblastoma cell lines (SKNSH and SHEP; bottom) in standard medium and conditioned medium (CM). Grey, untransduced cell line, standard medium; light green, GFP-transduced cell line, standard medium; dark green, GFP-transduced cell line, CM. D, Bar plots of cell viability of six neuroblastoma cell lines, three MYCN-amplified (IMR5, LAN5, and BE2) and three MYCN-non-amplified (NBLS, SKNSH, and SHEP,) treated with etoposide (100 nmol/L for IMR5, LAN5, and BE2 and 1 µmol/L for NBLS, 5 µmol/L for SKNSH, and 10 µmol/L for SHEP) for 3 days in standard medium and in the presence of CM from neuroblastoma, TAMs, and CAFs triple cocultures. E, Bar plots of cell viability of three neuroblastoma cell lines, BE2, NBLS, and SHEP, treated with etoposide for 3 days as above in standard medium and in the presence of CM from triple cocultures with and without the NFκB nuclear translocation inhibitor JSH-23 (1 µmol/L for BE2, 35 µmol/L for NBLS, and 100 µmol/L for SHEP). F, Bioluminescence images of NOD/SCID gamma mice arms which were subcutaneously implanted with BE2-LUC neuroblastoma cells in the presence of human TAMs and CAFs (TME) treated with etoposide + vehicle (E + V; group 1) or etoposide + JSH-23 (E + J; group 2). Top, untreated in each group. G, Bar plots of bioluminescence levels of untreated mice in each group and treated mice (E + V; group 1 and E + J; group 2). H, Bar plots of tumor size in of treated mice (E + V; group 1 and E + J; group 2). D, diagnosis; DS, definitive surgery; U, untreated.

