Figure 1.
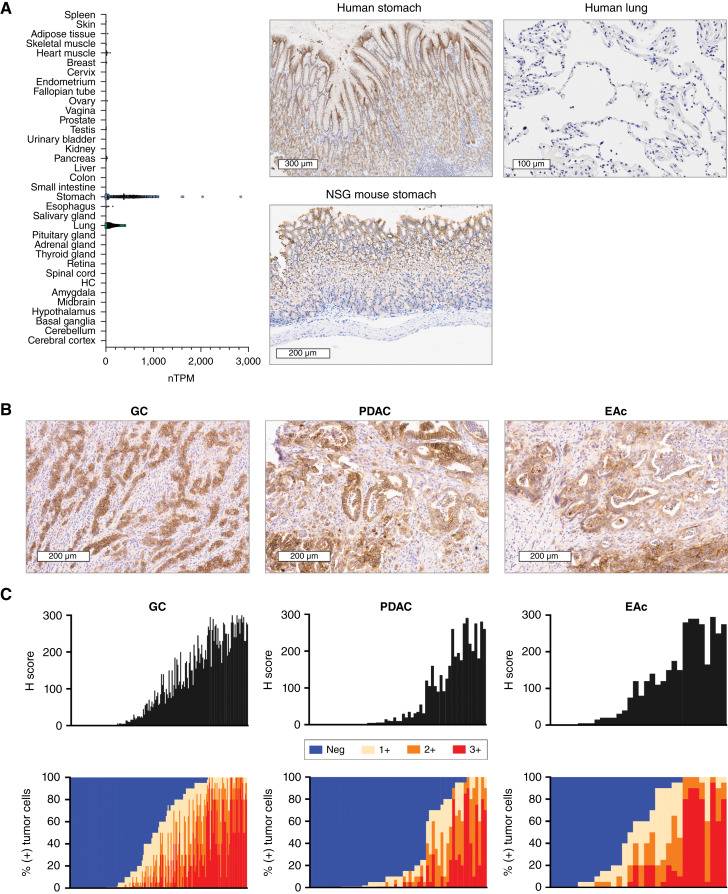
Expression and prevalence of CLDN18.2 in normal tissues and GI adenocarcinomas. A, Normal tissue RNA expression of CLDN18 [represented as normalized transcripts per million (TPM); Human Protein Atlas, GTEx dataset]. HC, hippocampal formation. CLDN18.2 expression on representative images of the human stomach, NSG mouse stomach, and human lung are shown. B, CLDN18.2 expression on representative samples of gastric cancer (H-score = 249), PDAC (H-score = 175), and esophageal adenocarcinoma (H-score = 175). C, Prevalence and intensity of CLDN18.2 expression on tumor samples derived from patients with gastric cancer (n = 185), PDAC (n = 61), and esophageal adenocarcinoma (n = 32). Data are shown as H-scores and as the percentages of tumor cells at each level of intensity (1+, 2+, and 3+). EAc, esophageal adenocarcinoma; GC, gastric cancer.

