Figure 2.
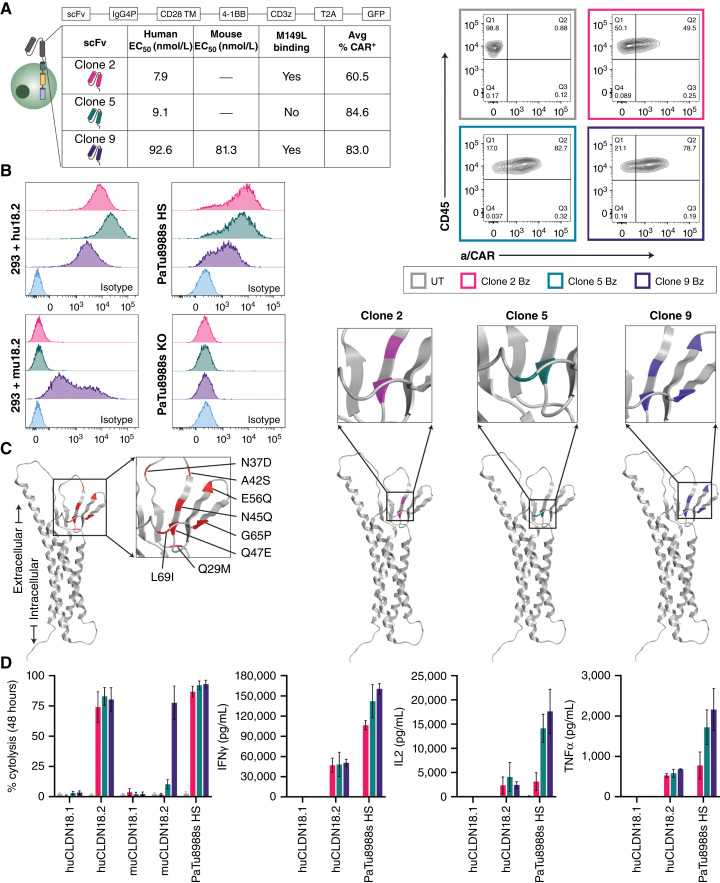
Development and evaluation of CLDN18.2-targeting CAR-T cells in vitro. A, Schematic representation of second-generation CAR-T lentivirus design, which includes a 4-1BB costimulatory domain (Bz). The table shows for each CLDN18.2-reactive clone the relative binding affinity (human and mouse), reactivity to mutant CLDN18.2 (M149L), and average transduction efficiency (CAR+, day 9) of multiple healthy donors. Representative FC plots of CAR surface expression at day 9 after lentivirus transduction were compared with UT control for a single donor. B, CLDN18.2 cell surface expression of various cell lines as determined by FC with 5 μg/mL CLDN18.2-reactive clones compared with nonspecific isotype antibody (R347). C, Epitope characterization of CLDN18.2-reactive clones. The AlphaFold structure on the far left (red) represents all sites of point mutation in HEK293 cells that vary between CLDN18.1 and CLDN18.2 in the first extracellular loop; the color-coded diagrams represent sites that influence respective clone binding. D, Percent cytolysis of HEK293 + huCLDN18.1, HEK293 + huCLDN18.2, HEK293 + muCLDN18.1, HEK293 + muCLDN18.2, and PaTu8988s HS cells determined by xCELLigence RTCA assay after 48 hours of co-culture with CLDN18.2 CAR-T cells at a 1:1 E:T ratio. The supernatants from the xCELLigence assay were collected at 24 hours for cytokine assessment (Meso Scale Discovery) assay. All data represent mean ± SEM of replicate experiments.

