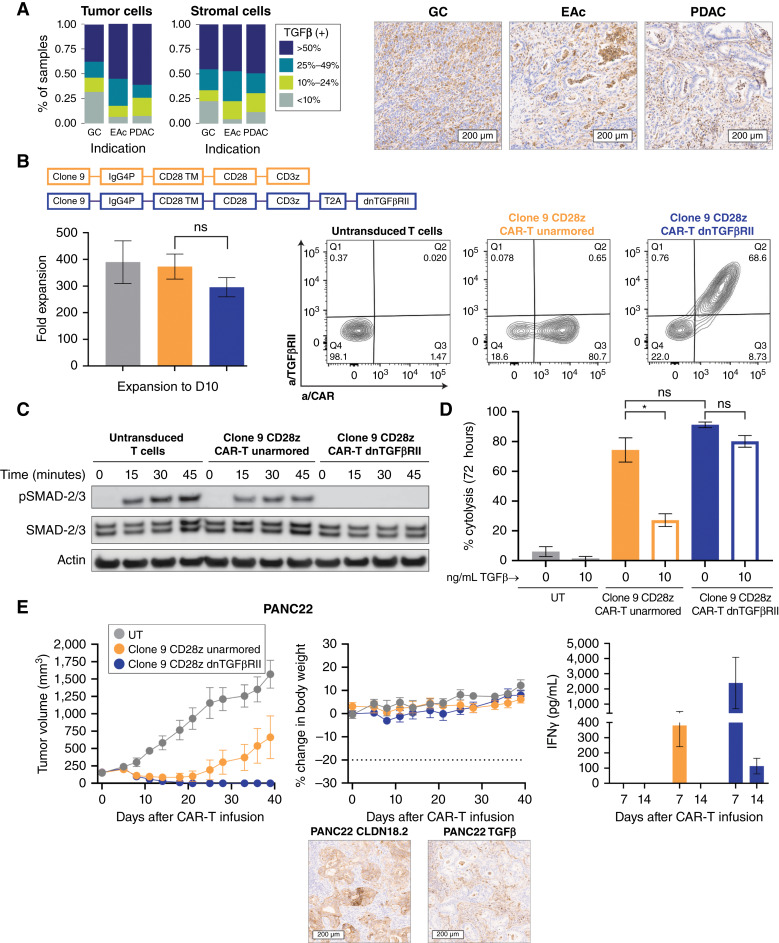
Figure 4.
Rationale for selection of TGFβ armoring and proof of mechanism in vitro and in vivo. A, Quantitative analysis of intensity and prevalence and representative images of TGFβ staining in a subset of patient tumor samples [gastric cancer (GC), n = 130; esophageal adenocarcinoma (EAc), n = 15; PDAC, n = 71]. Data represent the pooled scores of tumor and stromal compartments. B, Schematic representation of second-generation CAR-T lentivirus design, including an IgG4P hinge, CD28 transmembrane, CD28 costimulatory domain, and CD3z (unarmored CAR-T cells) or additional T2A self-cleaving peptide and dnTGFβRII (armored CAR-T cells). Average fold expansion across multiple healthy donors is shown. There was no significant difference in expansion across groups (one-way ANOVA). Representative FC plots show CAR and TGFβRII surface expression at day 10 after lentivirus transduction compared with UT control. C, FACS-purified, serum-starved CAR-T cells were stimulated with 1 ng/mL rhTGFβ for various time periods. Western blotting was used to determine protein levels of p-SMAD2/3 and total SMAD2/3; β-actin was used as the loading control. D, Percent cytolysis of BxPC3 + CLDN18.2 cells as determined by xCELLigence RTCA assay after 72 hours of co-culture at a 1:1 ratio with CLDN18.2 CAR-T cells in the presence or absence of 10 ng/mL rhTGFβ. Results were analyzed by using paired t tests. E, NSG mice bearing pancreatic PDX (PANC22, H-score = 225, TGFβ intermediate) were dosed by tail vein with 3e6 CAR+ unarmored or dnTGFβRII CLDN18.2 CAR-T cells; the total T-cell infusion number was matched across groups. Tumor volume and body weight were measured biweekly (n = 5). Serum levels of IFNγ were measured at 7 and 14 days after infusion (n = 3). Representative images of CLDN18.2 and TGFβ staining IHC expression (20× scan) are shown. All data represent mean ± SEM of replicate experiments or animals.

