Figure 5.
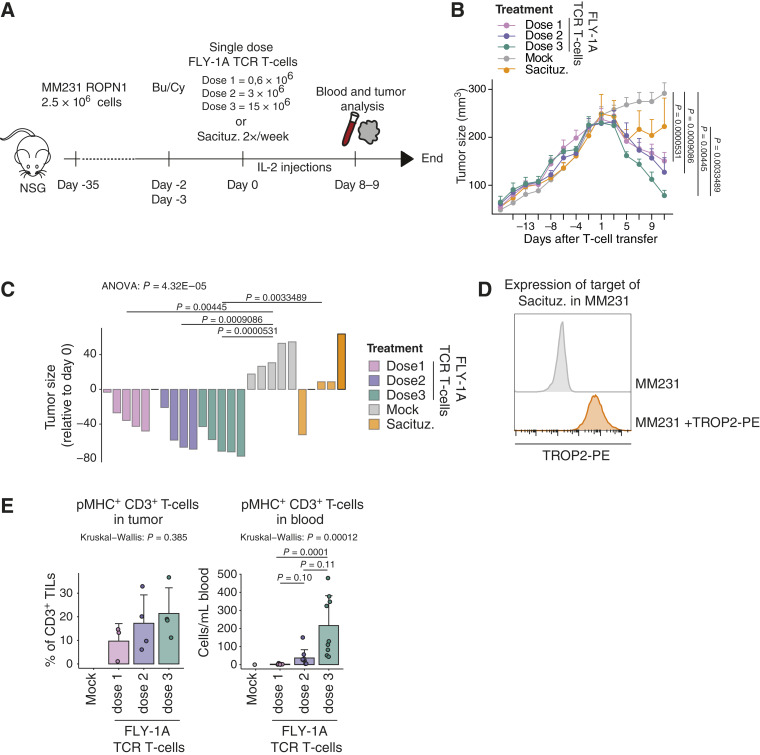
FLY-1A TCR T cells lead to dose-dependent regression of large TNBC tumors and significantly outperform standard-of-care treatment in vivo. A, Scheme depicting the in vivo study design (see “Methods” for details). NSG mice bearing palpable subcutaneous tumors derived from MM231 ROPN1 cells were treated with either 1 transfer of FLY-1A TCR T cells (0.6, 3, or 15 × 106 TCR+ CD3+ T cells), mock T cells (equal to the no. of cells given for highest TCR T-cell dose), or sacituzumab govitecan (0.4 mg/kg) 2 times per week. Blood (n = 9 per group) and tumors (n = 4 per group) were collected at day 8/9. B, Line graph shows tumor size over time in mice treated with FLY-1A TCR T cells (dose 1: pink; dose 2: purple; dose 3: green), mock T cells (gray), or sacituzumab govitecan (orange; n = 5 per group). C, Waterfall plot represents tumor size at day 11 relative to day −1 per mouse per group (the same colors as in B). ANOVA test was performed followed by Tukey’s post hoc test. Only significant differences are shown. D, Flow cytometric determination of TROP2 protein expression in parental MM231 cells stained with antibody (depicted in orange) or not (negative control, depicted in gray). E, Presence of TCR T cells in tumor (left) and blood (right). T cells binding pMHC that were either present in single tumor cell suspensions or peripheral blood samples were detected by flow cytometry (see “Methods” for details). Individual points, mean, and SD are shown. The Kruskal–Wallis rank test was performed followed by Dunn’s multiple comparisons test. Significant differences between different treatments vs. mock T cells were not calculated because of low numbers. Bu/Cy, busulfan and cyclophosphamide; Sacituz., sacituzumab govitecan.

