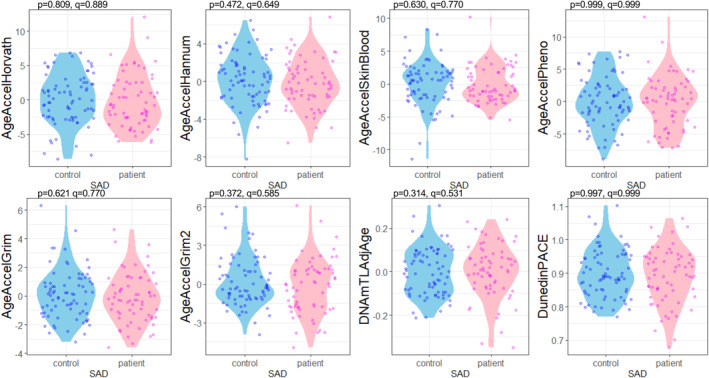
FIGURE 1.

Violin plot showing age acceleration for each group. The p values were calculated by multiple regression analyses to test the association between each epigenetic age acceleration and phenotype (SAD or controls), and the q values were calculated with Benjamini Hochberg adjustment. Blue dots indicate data from the control group, and magenta dots indicate data from the patient group. This diagram was created using the R package ggplot2. DNAmTLAdjAge, age‐adjusted estimate of DNA methylation‐based telomere length; SAD, social anxiety disorder.
