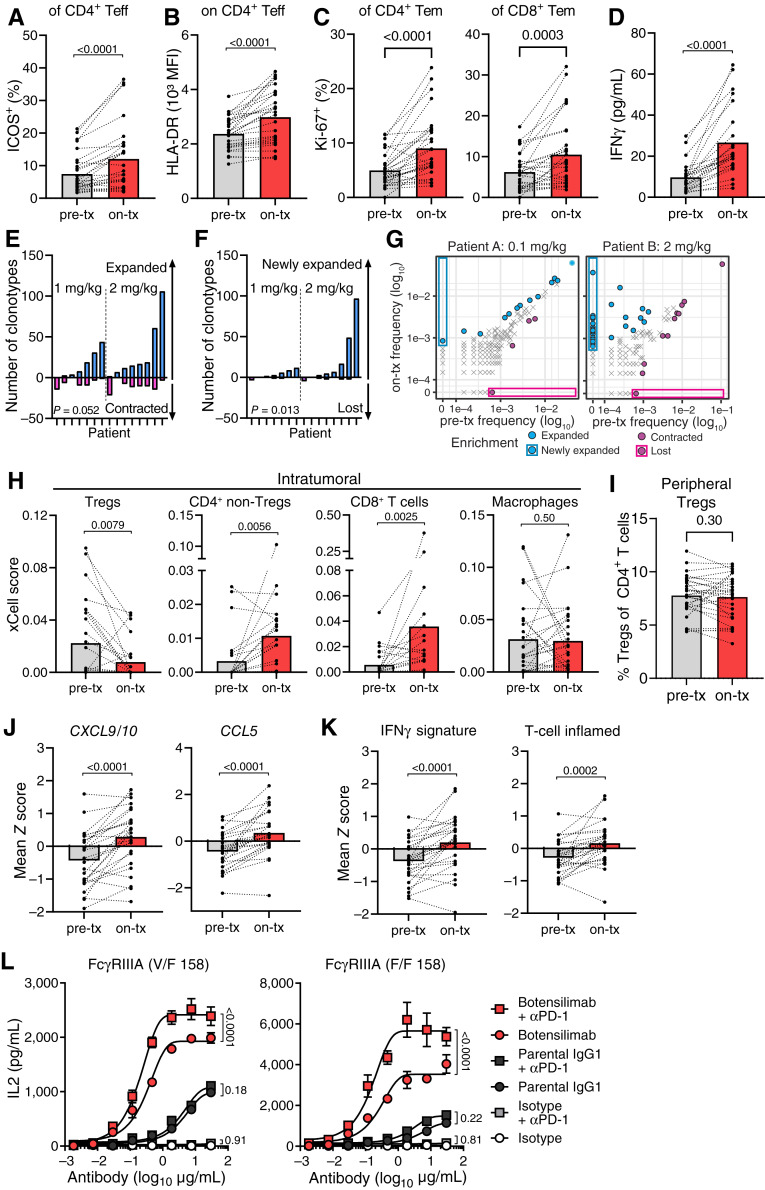
Figure 5.
Botensilimab enhances activated T-cell prevalence, reduces intratumoral Tregs, and upregulates genes associated with T cell–inflamed tumors in patients with advanced solid cancers. A–G, Pretreatment (pre-tx) and on-treatment (on-tx) blood samples from patients treated with 1 or 2 mg/kg botensilimab monotherapy. PBMC analyzed by flow cytometry for the (A) frequency of ICOS+ and (B) HLA-DR mean fluorescence intensity (MFI) on CD4+ Teff (CXCR3+) and (C) frequency of Ki-67+ CD4 and CD8 effector memory (Tem, CD45RO+CCR7−) T-cell subsets (n = 28; on-tx: 7 days after first dose). D, Plasma IFNγ in pre- and on-tx samples (n = 23; on-tx: 24 hours after first dose). Number of (E) expanded vs. contracted and (F) newly expanded vs. lost T-cell clonotypes in pre-tx vs. on-tx blood by differential abundance analysis between baseline (pre-tx; cycle 1 day 1) and 3–4 weeks postdose (n = 15; pre-tx: cycle 1 day 1; on-tx: 3–4 weeks after first dose). P values compare expanded vs. contracted T-cell clonotypes in E and F. G, T-cell clonotype abundance in two representative patients treated with 0.1 or 2 mg/kg botensilimab every 3 weeks. CDR3 sequencing of human TCRβ chains performed using immunoSEQ. H, Intratumoral cell type enrichment scores calculated using xCell for Tregs, CD4+ non-Tregs, CD8+ T cells, and macrophages as determined from RNA-seq of pre-tx and on-tx tumor biopsies from patients treated with 1 or 2 mg/kg botensilimab monotherapy every 3 or 6 weeks ± balstilimab every 2 weeks (n = 26; on-tx: cycle 2 day 1 for every 6-week cohort, or cycle 3 day 1 for every 3-week cohort). I, Percent peripheral Treg (CD4+, CD127low/−, CD25+) subsets (n = 28; on-tx: 7 days after first dose) analyzed by flow cytometry from patients treated with 1 or 2 mg/kg botensilimab monotherapy. J, Intratumoral CXCL9 and CXCL10 and CCL5 gene expression and (K) IFNγ and T cell–inflamed gene expression signatures (53) as determined from RNA-seq of pre-tx and on-tx tumor biopsies (n = 26). L, IL2 secretion from SEA-stimulated PBMC from FcγRIIIA heterozygote V/F 158 and FcγRIIIA homozygote F/F 158 donors treated with botensilimab, parental IgG1, or IgG1DLE isotype, alone ± αPD-1 (balstilimab). Paired data points with group mean (A–D and H–K) or mean ± SEM (L). Data analyzed with the two-tailed Wilcoxon matched-paired t test (A–F and H–K) or two-way ANOVA with the Tukey multiple comparisons test (L).

