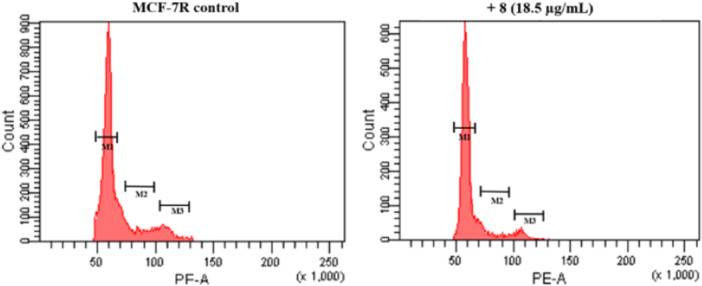
Figure 1.

Cell cycle analysis in the MCF‐7R cell line. Cells were treated for 48 h with fraction 8 at the corresponding IC50 value of 18.5 µg/mL and their distribution in the phases of the cell cycles was assessed through flow cytometry analysis of their DNA stained with propidium iodide. The panel shows a representative experiment of three independent experiments.
