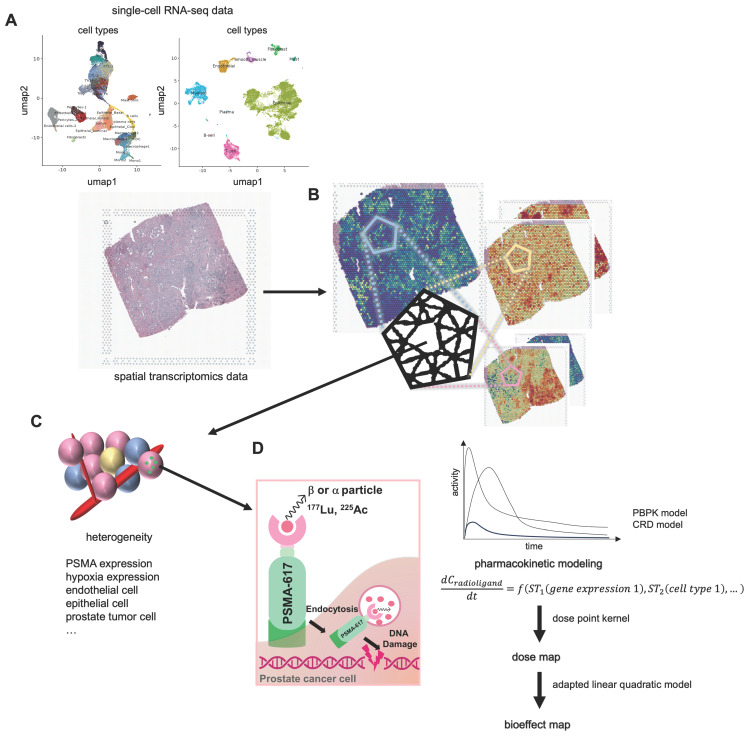
Figure 1.
Schematics of dose and bioeffect modeling on based spatial transcriptomics (ST). (A) The distributions of various cell types (endothelial, epithelial, tumor, …) are determined using CellDART utilizing single-cell RNA-seq data (scRNA-seq) and ST. (B) The tissue composition is subsequently clarified by delineating the spatial distribution of distinct cell types and gene expressions. (C) Each ST spot comprises a small number of cells, each contributing to the heterogeneity of the tumor microenvironment (TME). (D) The prostate-membrane specific antigen (PSMA, green) is expressed on the surface of the prostate cancer cell (magenta). Radioligands labeled with 177Lu or 225Ac are primarily utilized for PSMA-targeted radiopharmaceutical therapy (RPT), emitting beta and alpha particles, respectively. Simulating the time-activity curve (TAC) of the radioligand in each spatial transcriptomics (ST) spot involves solving a partial differential equation (PDE) representing a pharmacokinetic model. Dose and its bioeffect are modeled using a dose point kernel (DPK) and a modified linear quadratic (LQ) model. This allows for the assessment of RPT efficacy in each ST spot.

