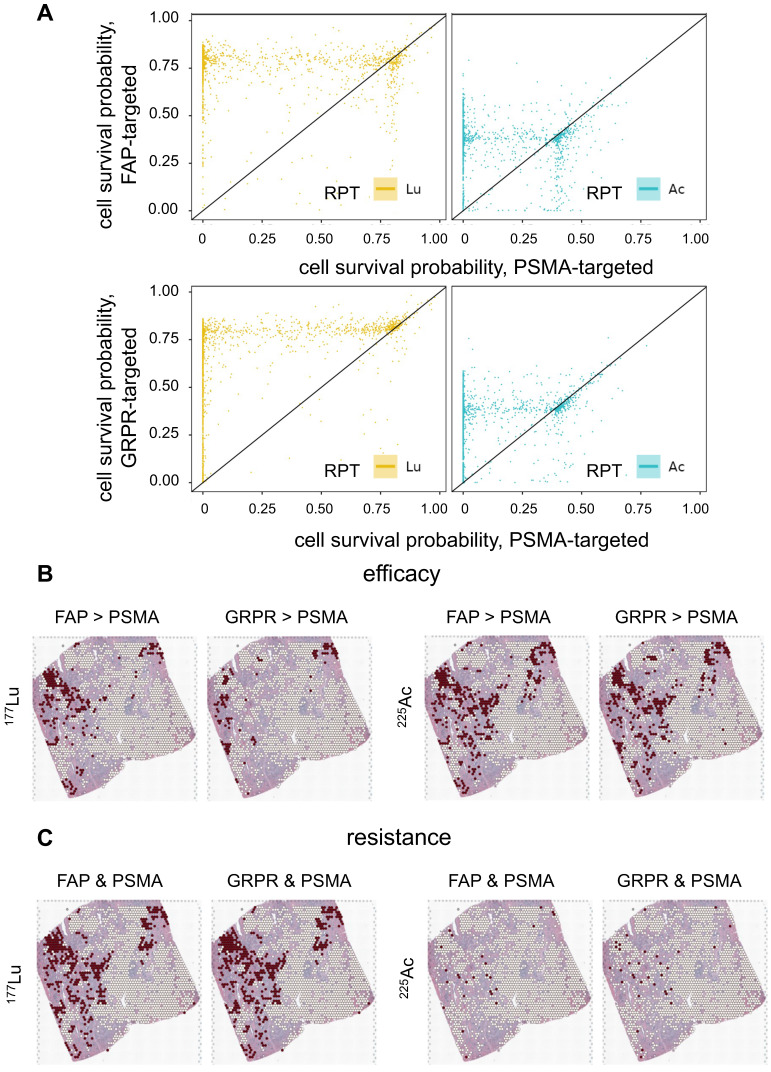
Figure 7.
Efficacy of RPT utilizing various targets: Fibroblast activation protein (FAP), gastrin-releasing peptide receptor (GRPR) and prostate-specific membrane antigen (PSMA). (A) The scatter plots show the comparison in cell survival probability between FAP-/GRPR-targeted RPT and PSMA-targeted RPT. The dots located below the diagonal line indicate the region where the efficacy of the PSMA-targeted RPT is lower than that of the FAP- or GRPR-targeted RPT. (B) The spatial distribution of spots showing higher efficacy in either FAP- or GRPR- compared to PSMA-targeted RPT. (C) The spatial distribution of the spots showing resistance in both FAP-PSMA and GRPR-PSMA pairs. The red dots indicate the corresponding locations of the spots, while the white dots represent the remaining spots within the tumor-cell abundant region using threshold of 0.01.

