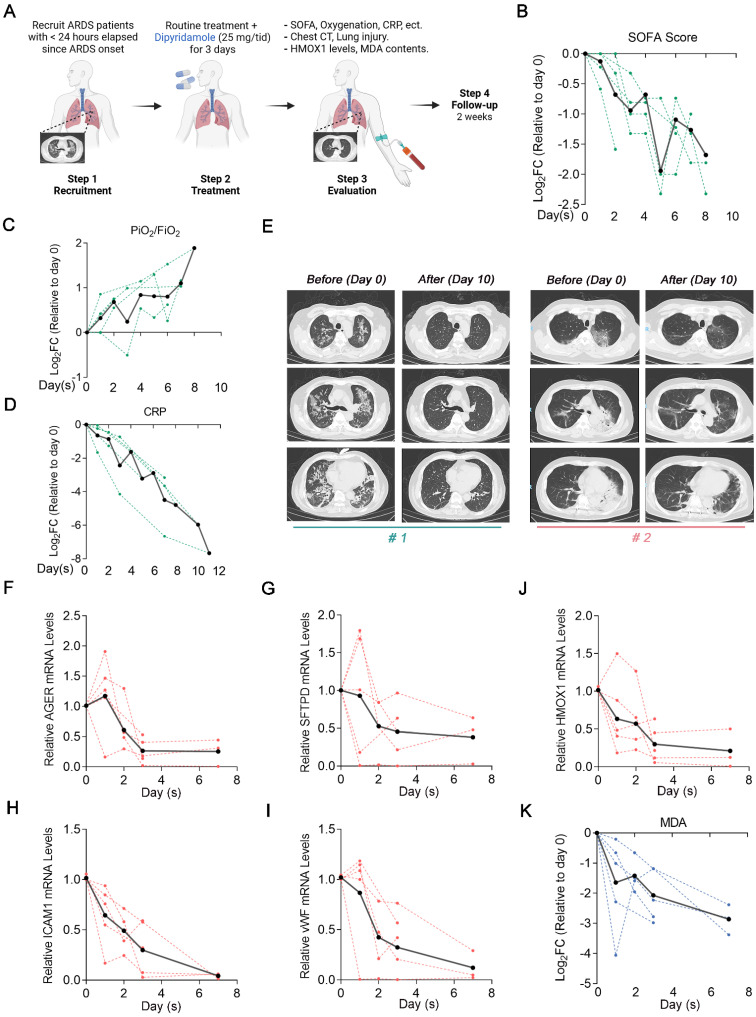
Figure 8.
Clinical evaluation of DIPY in patients with ARDS indicates beneficial effects. (A) Clinical study flow chart. Peripheral blood sampling was performed at baseline before the first dose of DIPY and 1, 2, 3, and 7 days after the initiation of DIPY adjunctive treatment, respectively. Patients were monitored for 14 days after completion of DIPY treatment. (B-D) Clinical parameters post-DIPY treatment. SOFA score at indicated time points after DIPY treatment, normalized to day 0 (pre-DIPY treatment, B). PiO2/FiO2 ratio at indicated time points after DIPY treatment, normalized to day 0 (C). CRP levels at indicated time points after DIPY treatment, normalized to day 0 (D). (E) Chest computed tomography scans of two subjects (#1 and #2) before DIPY treatment (Day 0) and 10 days after DIPY treatment (Day 10). (F-J) The mRNA levels of indicated injury markers (F for AGER, G for SFTPD, H for ICAM1, and I for vWF) and HMOX1 (J) in plasma from ARDS patients at indicated time points before and after DIPY treatment were analyzed using qRT-PCR. (K) MDA contents at indicated time points after DIPY treatment, normalized to day 0. (B-D, F-K) Data is shown with individual patient responses as dotted lines and the mean of all subjects as solid lines.

