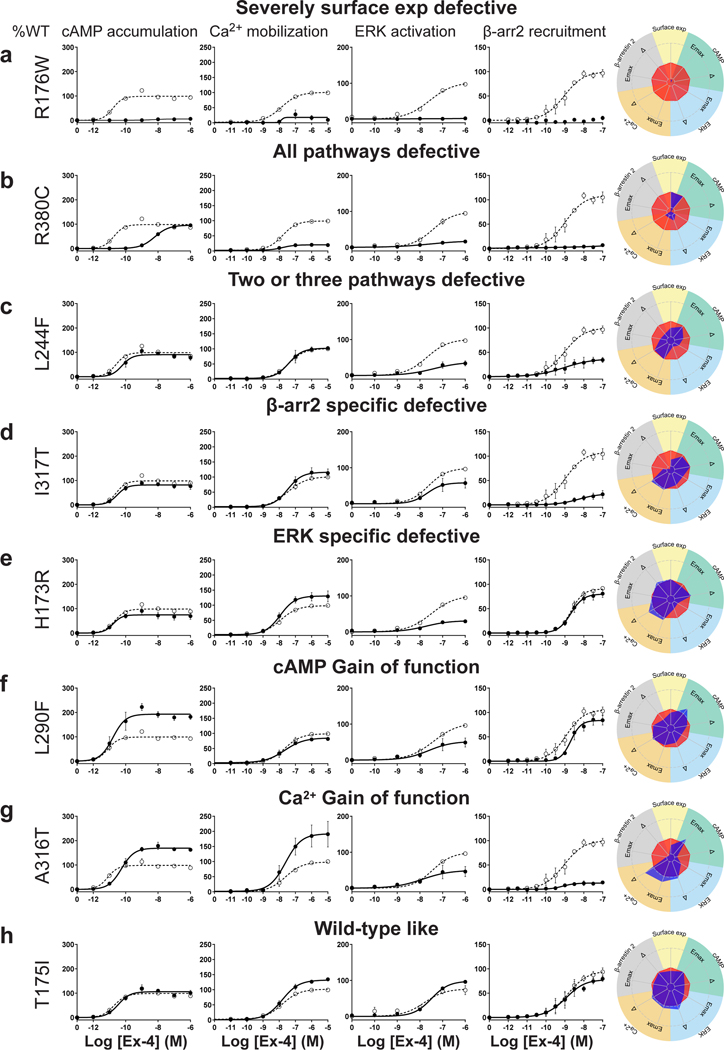
Figure 2. Functional Profiling of GLP1R Mutants Define Eight Categories.
a-g, Ex-4 concentration-response curves of cAMP production, Ca2+ mobilization, ERK activation, and recruitment and radial graphs of one representative GLP1R mutant of each category. Mutant GLP1R (solid lines with filled circles) and WT GLP1R (dotted lines with open circles) were monitored in parallel in each experiment. For radial graphs, data were normalized to WT GLP1R (set as zero), values of mutants ranged from −1 to +1, where 0 to +1 represent enhanced properties, and 0 to −1 represents impaired properties. All values are means ± SEM of 2–3 technical replicates of 3–8 independent biological replicates for each mutant. Exp, expression; ; Ex-4, Exendin-4. See also Extended Data Fig. 4 to Extended Data Fig. 7 and tables S2 and S3 for complete data sets for the agonist-mediated signaling activity of GLP1R mutants.

