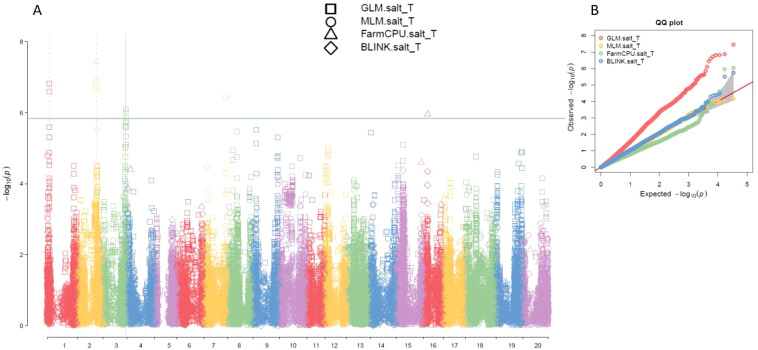
Figure 3.
Multiple Manhattan plot (A) and QQ plot (B) of SNP significant level for salt tolerance among GLM, MLM, FarmCPU, and BLINK models in GAPIT3 in an association panel consisting of 563 germplasms. The Manhattan plot (left) illustrates soybean 20 chromosomes on the x-axis and LOD (-log(P-value)) values on the y-axis. The QQ plot (right) displays LOD (-log(P-value)) values on the x-axis and expected LOD (-log(P-value)) values on the y-axis.

