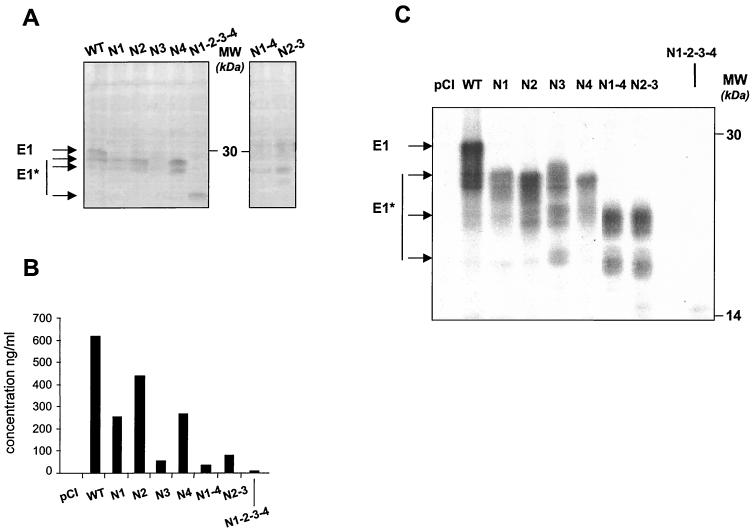
FIG. 2.
In vitro expression studies following transient transfection of NIH 3T3 cells with the DNA-encoding E1 mutants. (A) Western blot. (B) Quantitative determination of intracellular expression of E1 mutants by capture ELISA. (C/) Immunoprecipitation (see Materials and Methods). The figure shows representative experiments. HCV proteins are indicated (E1* refers to the deglycosylated forms of E1), and positions of protein size markers are shown.

