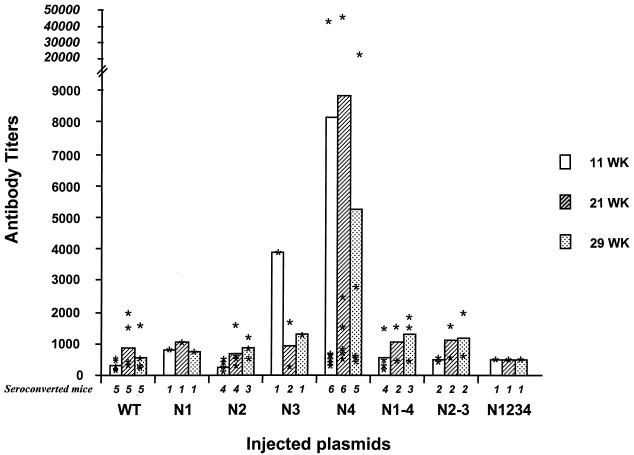
FIG. 4.
Anti-E1 antibody titers and seroconversion rates. Each plasmid encoding E1 wild type (WT) or an E1 mutant was injected into groups of six mice. Titers, given for seroconverted mice only, are represented for each individual mouse with stars, while mean titers are indicated by bars. Titers are shown for sera obtained 11, 21, and 29 weeks postimmunization. The number of seroconverted mice is indicated at the bottom of each bar. Results are shown as the reciprocal of the serum dilution resulting in an OD equal to two times the mean of the background of the assay.

