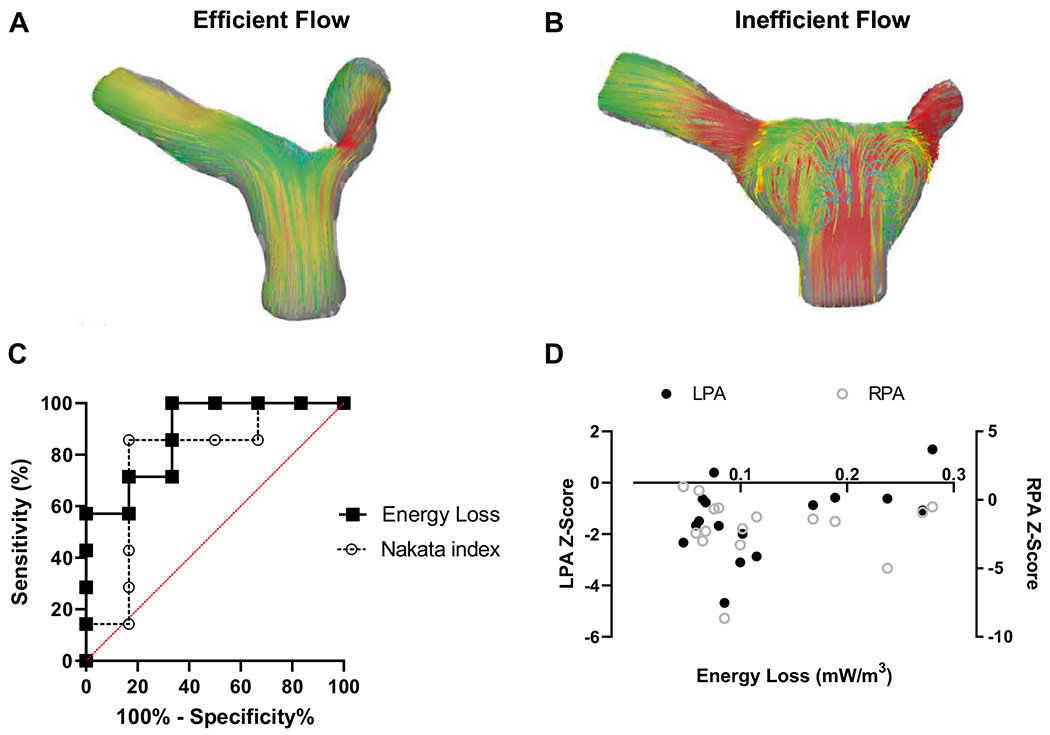
Fig. 5.

Energy loss is not correlated with branch PA stenosis and offers improved detection of RV mass over stenotic index alone. Segmented PA models with streamlines are shown at peak systole, demonstrating relatively efficient flow patterns A compared with relatively inefficient flow (B). C Receiver operating characteristic curve shows that maximum systolic energy loss detects elevated RV Mass above 30 g/m2 (p = 0.022, AUC 0.88) but Nakata index does not (p = 0.087, AUC 0.79). D Maximum systolic energy loss and left (left axis) and right (right axis) PA proximal axial diameter Z-score exhibit no significant correlation (p = 0.076, r = 0.46 and p = 0.965, r = − 0.01, respectively)
