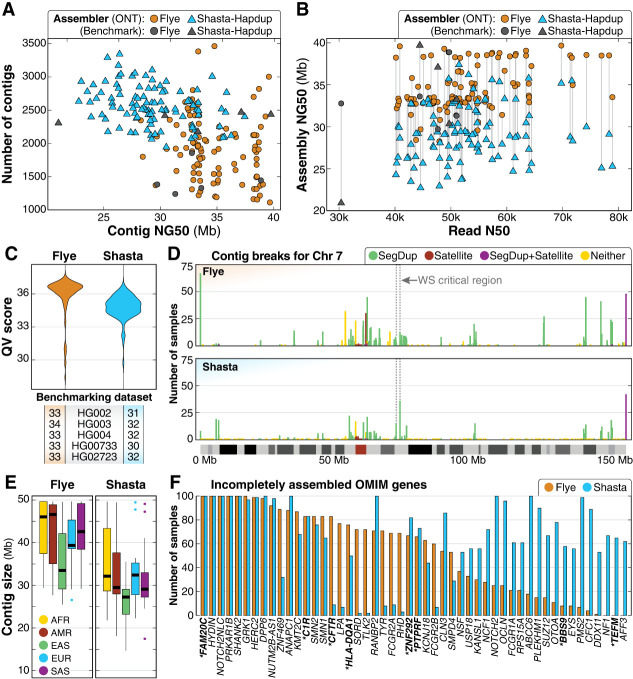
Figure 2.
Summary of de novo assembly results. (A) Contig NG50 compared to the total number of contigs shows that haploid assemblies generated by Flye are longer and have fewer contigs than Shasta–Hapdup. No contig NG50 generated by Flye exceeds 40 Mbp. Assemblies for each benchmarking sample show similar statistics. (B) Assembly NG50 does not significantly improve with higher read N50. (C) QV scores for both Flye and Shasta–Hapdup assemblies, and the five benchmarking genomes. (D) Count of contig breaks for all 100 samples on Chromosome 7 shows that while assembly breaks cluster there are a large number of single breaks spread across the chromosome. The 1.5–1.8 Mbp Williams–Beuren syndrome critical region is indicated with a dashed box and is flanked by clusters of assembly breaks within segdups (Morris 1993). (E) Contig sizes filtered for contigs longer than 1 Mbp for each superpopulation. (F) OMIM genes incompletely assembled in 50 or more samples using Flye or Shasta–Hapdup. For Shasta–Hapdup, if one haplotype was completely assembled in a sample but the other was incomplete, the gene is counted as incompletely assembled. Assembly of five genes (FAM20C, HYDIN, NOTCH2NLC, PRKAR1B, and SHANK2) was incomplete for all 100 samples using both assemblers. Genes that are not in or do not contain a segdup are in bold with an asterisk.

