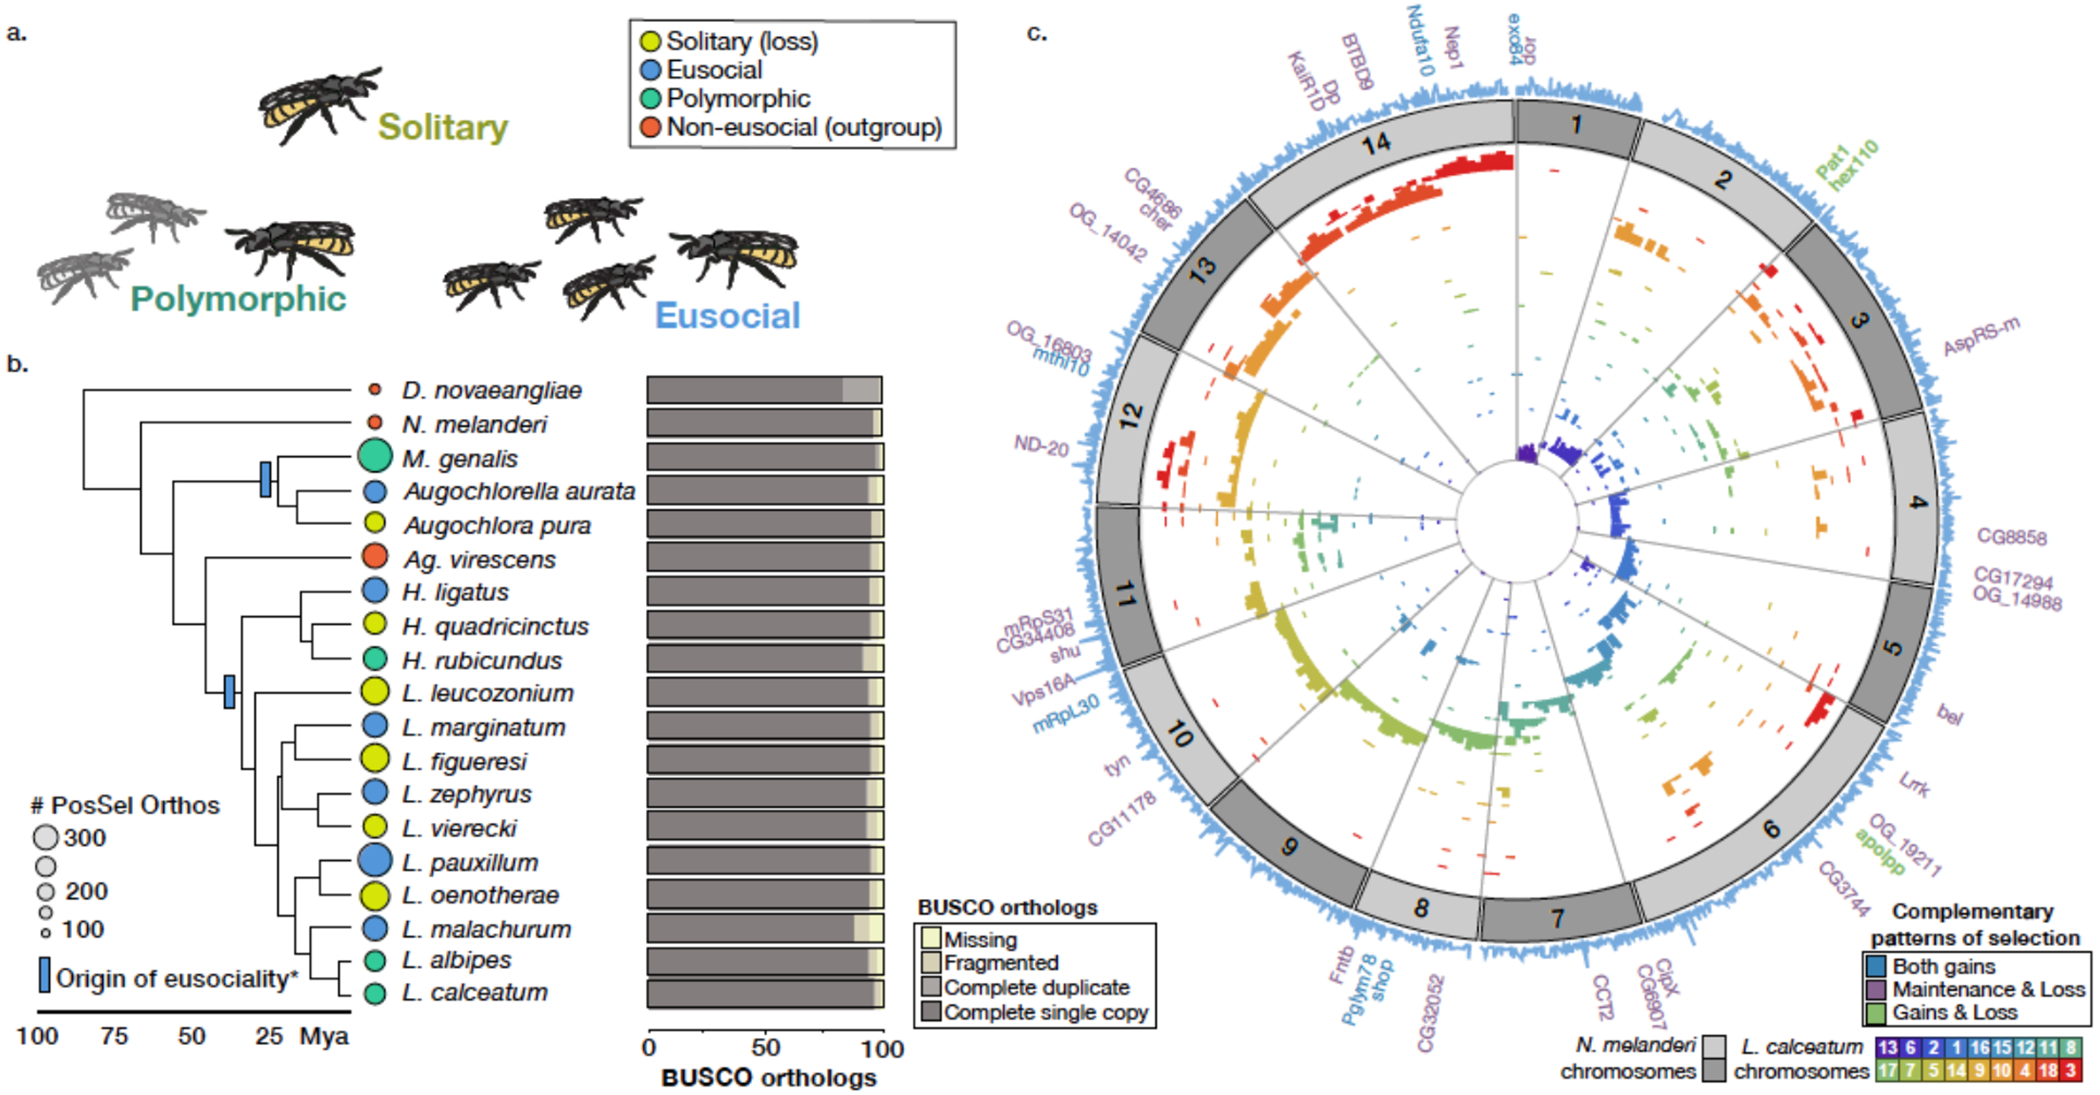
Fig. 1. Comparative genomic resources for halictid bees.

(A) Halictid bees encompass a wide range of behaviors, including solitary (yellow), eusocial (blue) and polymorphic species (green) capable of both solitary and eusocial reproduction. Non-eusocial outgroups (red) reproduce independently. (B) Pruned tree showing taxa included in this dataset. Colors at tips indicate species’ behavior, circle sizes proportional to the number of orthologs under positive selection on each terminal branch (abSREL, HyPhy133 FDR<0.05). Light blue rectangles denote gains of eusociality (*inferred from much broader phylogenies than shown here5). Proportions of complete/fragmented/missing BUSCO orthologs are shown for each genome. (C) Genomic data aligned to Nomia melanderi (NMEL). The 14 NMEL chromosomes are represented as a circular ideogram with consecutive chromosomes shown in alternating dark/light gray. The inner spiral comprises 18 color-coded tracks, each corresponding to one L. calceatum (LCAL) chromosome; the y-axis represents the frequency of regions aligning to the corresponding region in NMEL. Most alignments fall into a single “wedge”, indicating that each LCAL chromosome corresponds to just one NMEL chromosome, a pattern typical for sweat bees and unlike that of mammals (Extended Data Figs. 3–4). Outer blue line plot indicates number of branches where positive selection was detected at each gene (abSREL, FDR<0.05), and gene names shown are those with convergent/complementary patterns of selection: positive selection at both origins (blue), intensification of selection in extant eusocial lineages and relaxation of selection in secondarily solitary species (HyPhy RELAX, FDR<0.1; purple), and complementary patterns of both positive selection on the origin branches and convergent relaxation of selection with losses of eusociality (green). Not all genes in these categories are annotated in NMEL and some are therefore not labeled.
