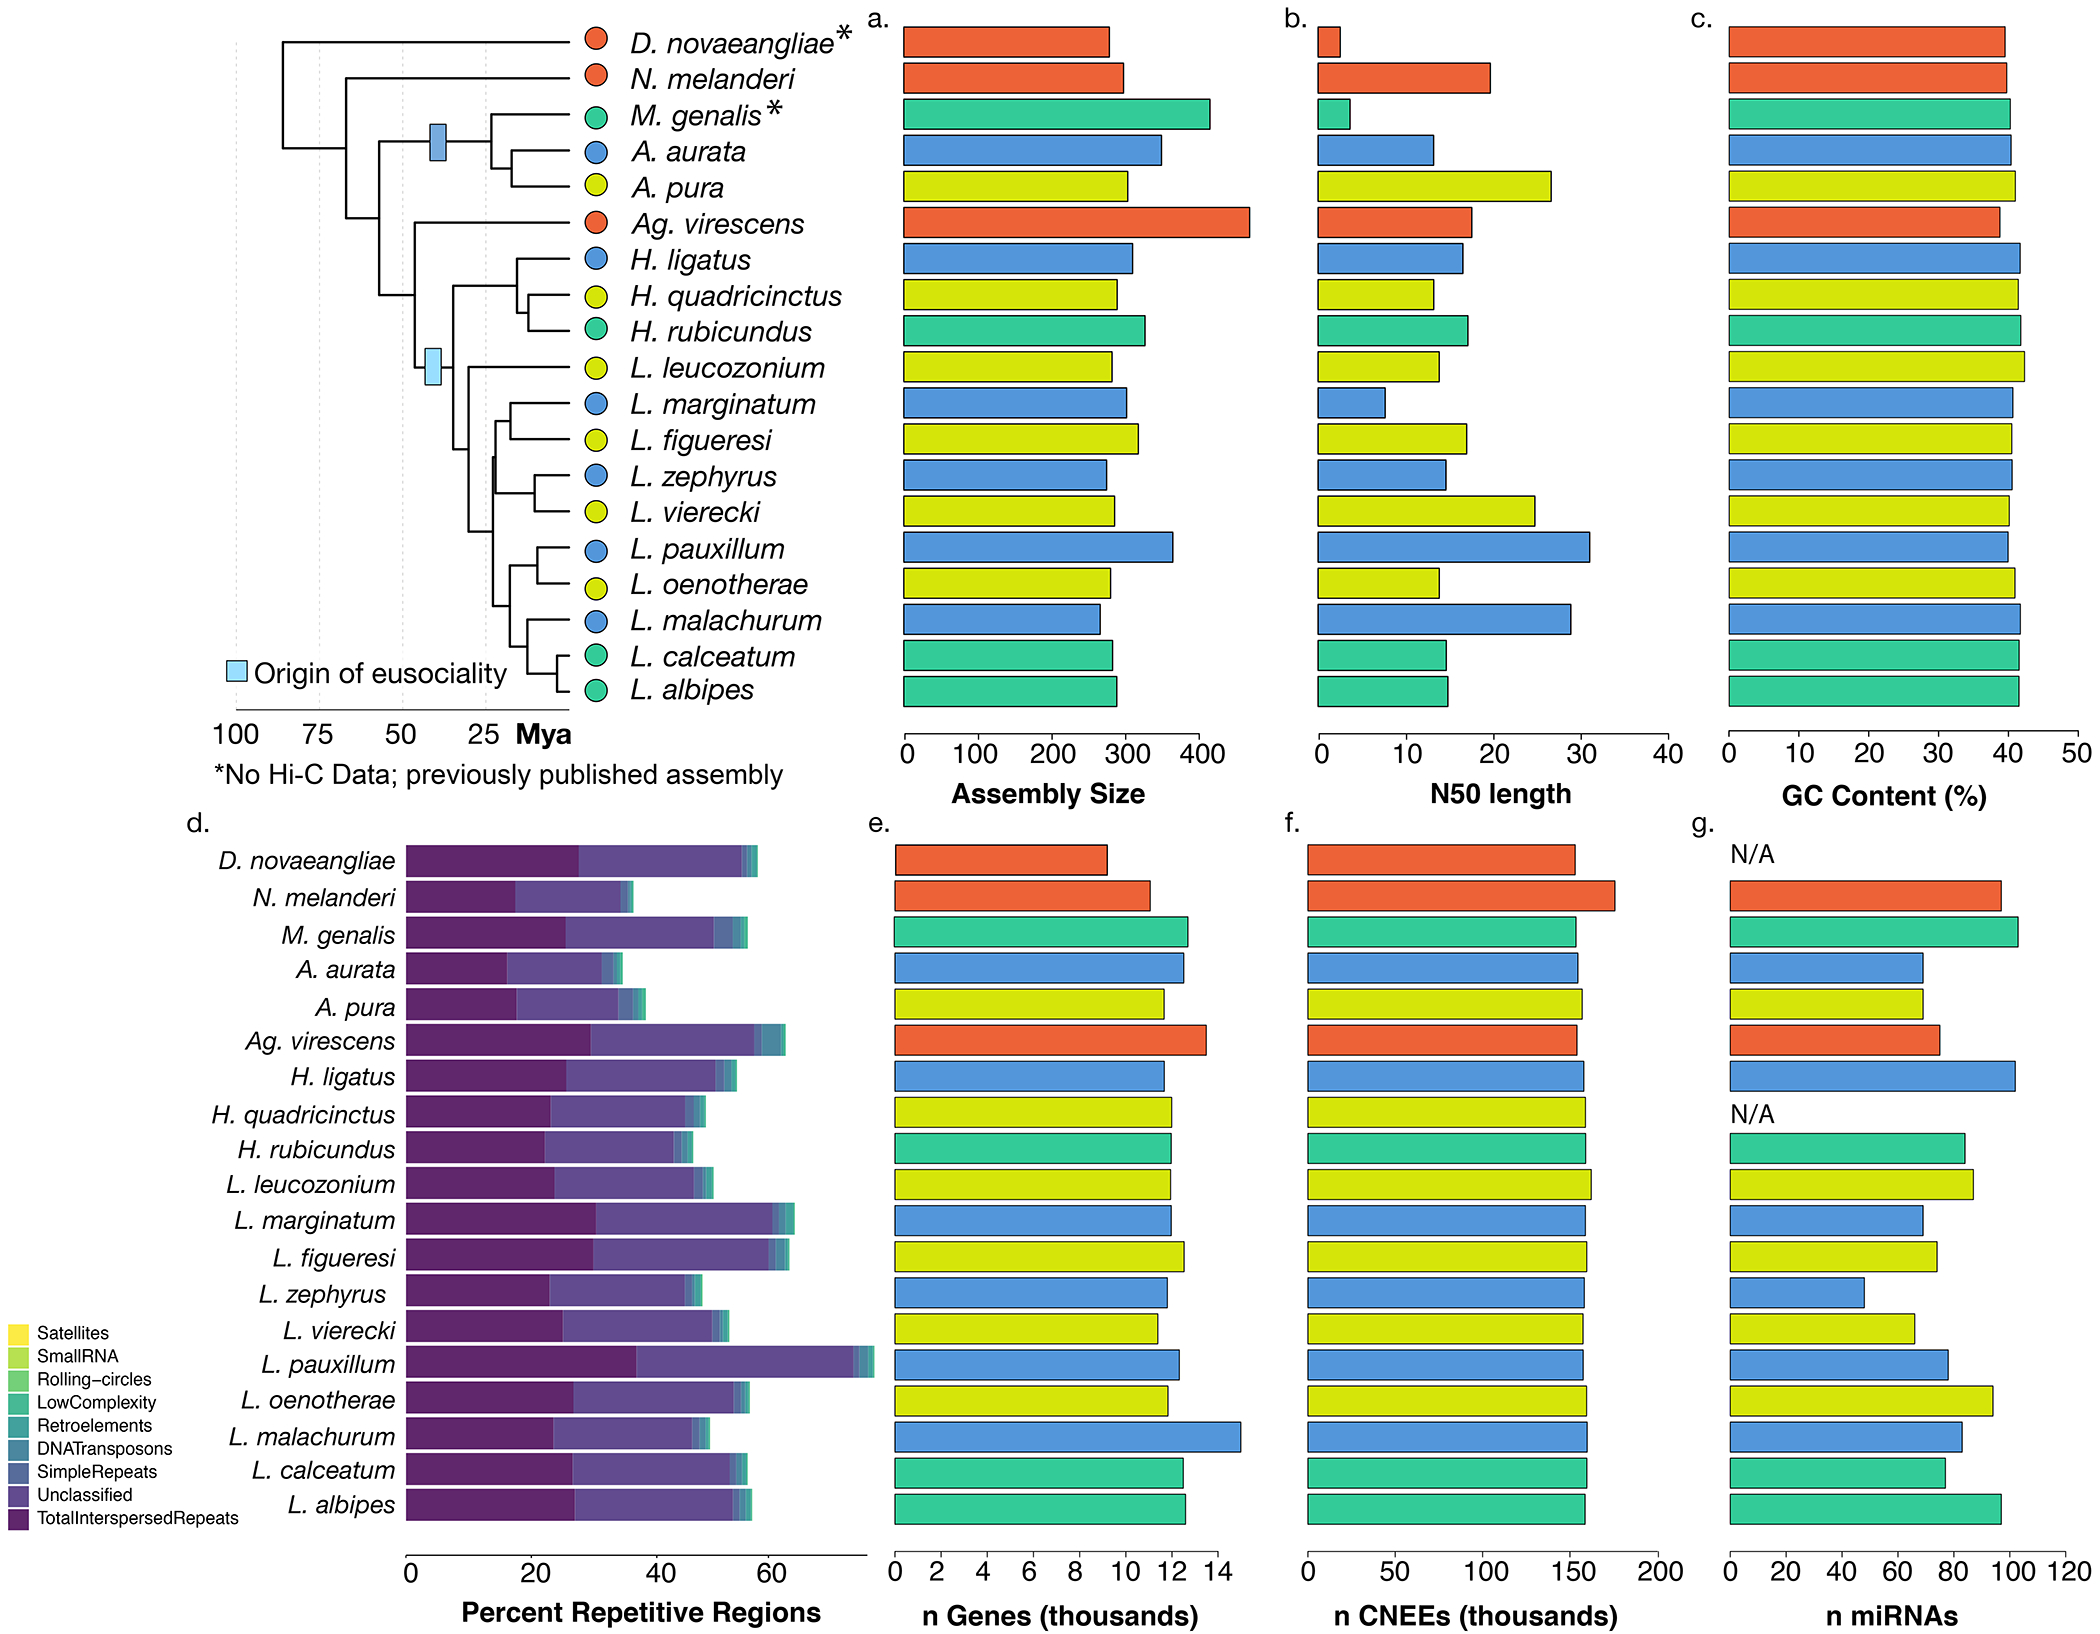
Extended Data Fig. 2: Genome assembly statistics.

Nineteen genomes are included in this comparative dataset. 15 de novo assemblies were generated using a combination of 10x genomics and/or Hi-C, and 2 previously-published genomes (N. melanderi11, L. albipes3) were improved by scaNolding with Hi-C data. M. genalis13 and D. novaeangliae12 were used as-is. (a) Genome assembly lengths ranged from ~300 to 420 Mb. (b) ScaNold N50s for each species following Hi-C scaNolding, and (c) GC content was consistent across species. (d) RepeatModeler was used to characterize diNerent types of repeats in the halictid assemblies. (e) Numbers of genes (in thousands) for each species following individual annotation. (f) Conserved non-exonic elements (CNEEs) were called using phastCons on a progressive Cactus alignment. (g) microRNAs were also characterized using brain tissue from available species and from34. For some species, fresh tissue was not available (N/A).
