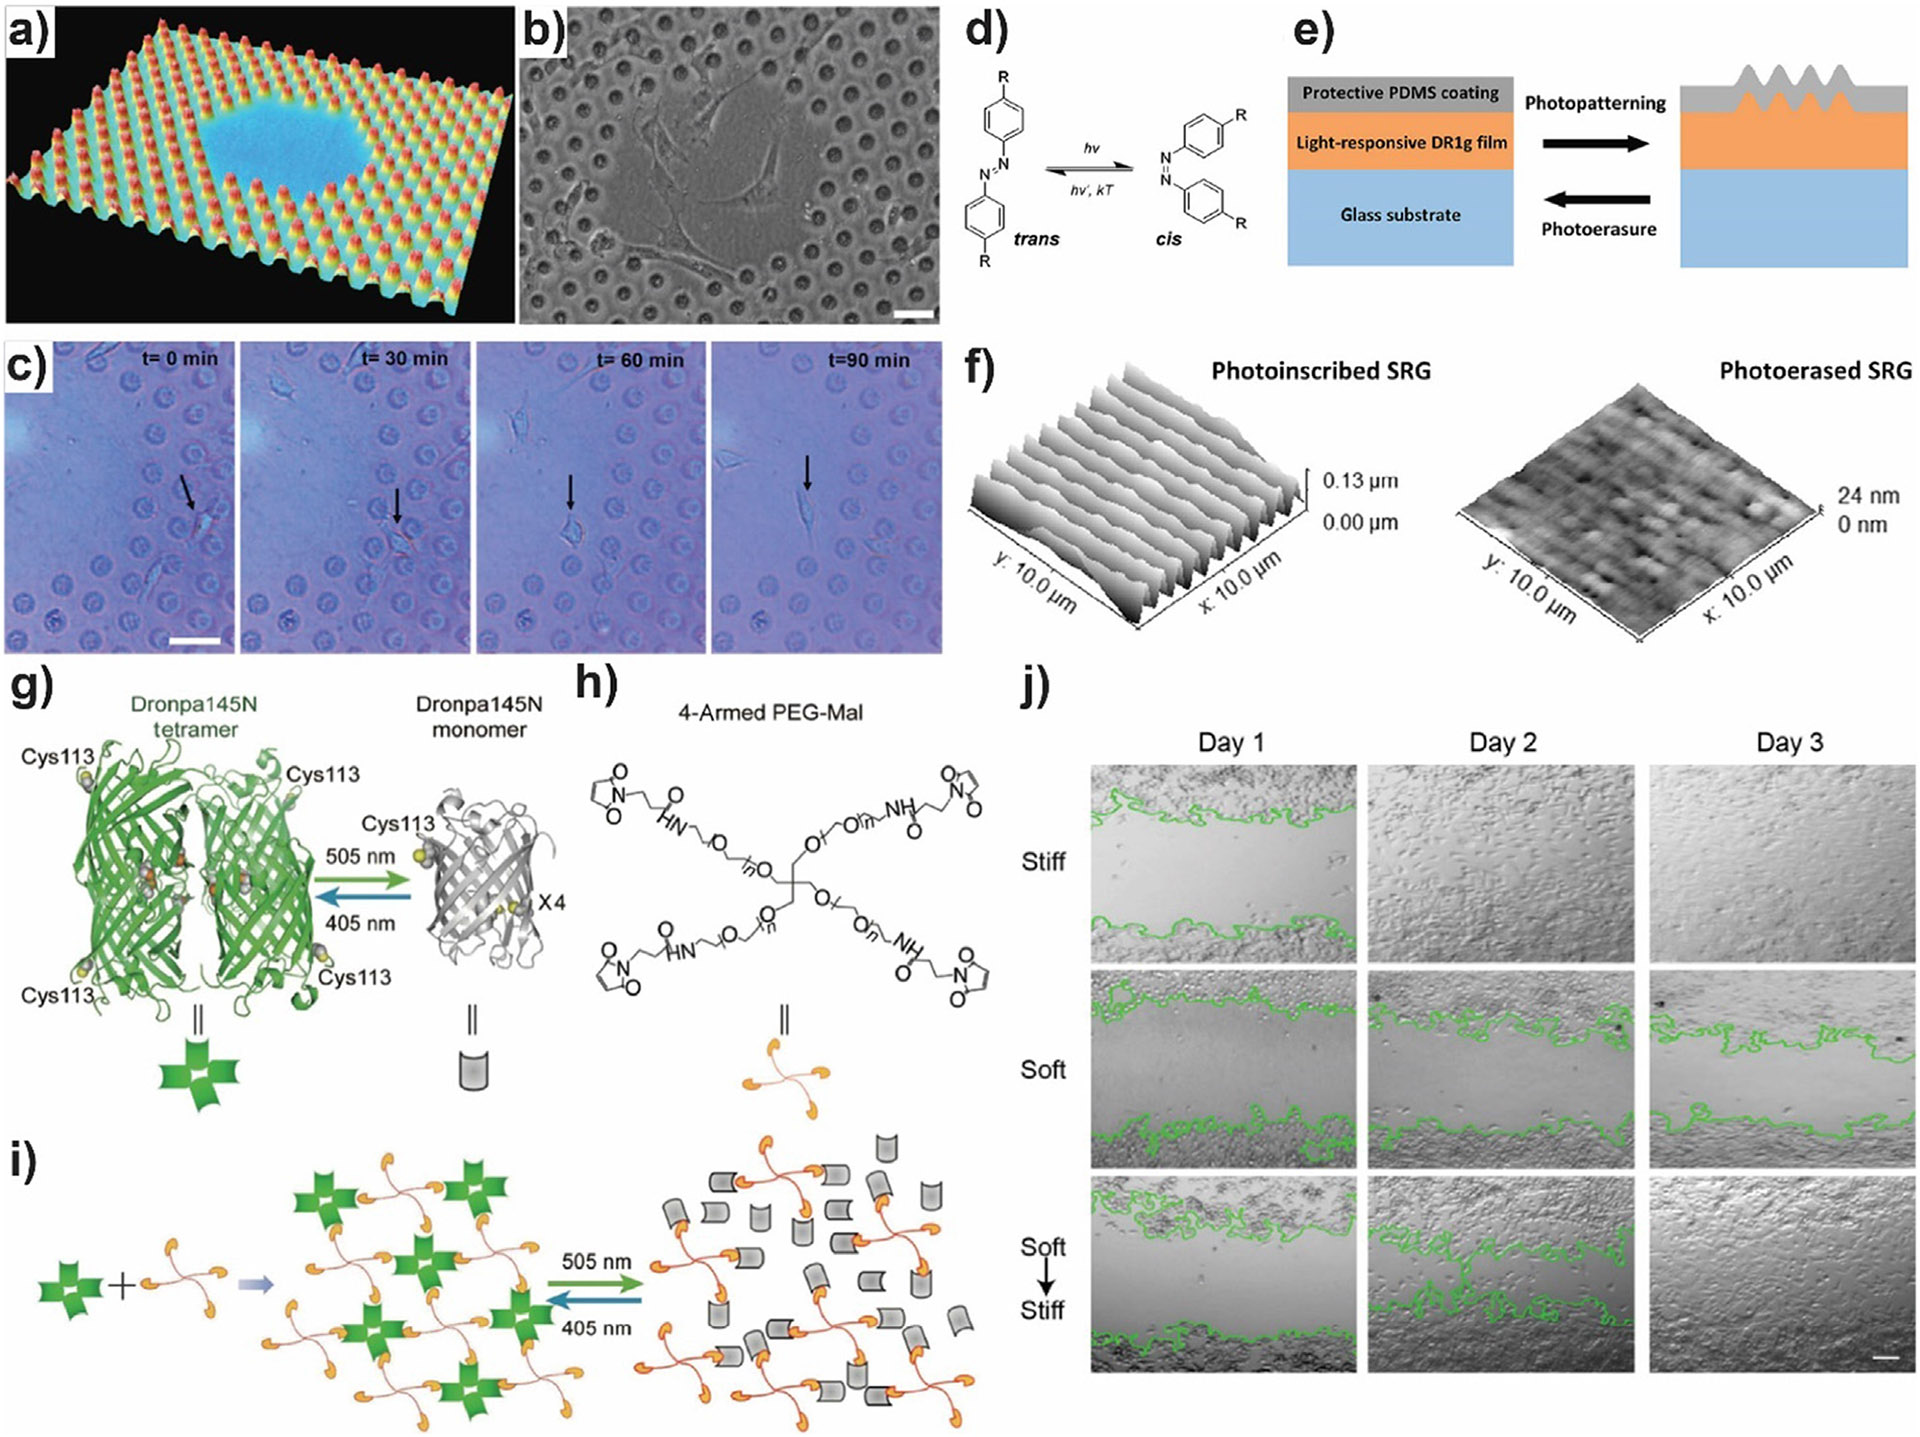
Fig. 2.

a) Three-dimensional representation of the mixed flat not entirely illuminated surface surrounded by hexagonally arranged pillars with a height of 1.1 μm. b) Phase contrast image of NIH3T3 fibroblasts on liquid crystal polymer network (LCN) surface after 3 days of culture. c) Live cell imaging of a representative cell going from the pillar area to the flat area. Scale bar: 50 μm. d) Photoisomerization of azobenzene between the thermodynamically stable trans isomer and the metastable cis isomer. e) Scheme of the bilayer structure and the azobenzene-driven surface relief gratings (SRG) formation and erasure (DR1g: disperse Red 1-containing molecular glass; PDMS, polydimethylsiloxane). f) AFM images of the surface topography of DR1g-PDMS1 after inscription (left) and erasure (right). g-j) Scheme of the photoresponsive hydrogel made of four-armed PEG crosslinked by Dronpa145N. g) Dronpa145N oligomerization states can be switched by irradiation with cyan and violet light. In both states, only one thiol group is exposed. h) Four-armed PEG- maleimide chemical structure. Maleimide end of each arm can react with thiol exposed from Dronpa145N.i) Illustration of the gel (left), sol (right) and photocontrolled sol–gel transition. j) Controlling cell migration in a wound closure experiment by tuning hydrogel stiffness. Representative pictures taken at different time points. The green line shows the colony interface. Scale bar 50 μm. a)-c) Adapted with permission from [85]. Copyright 2017 Wiley. d)-f) Adapted from [86]. g)-j) Reprinted by permission from [88], Copyright 2018 Springer Nature.
