Figure 1.

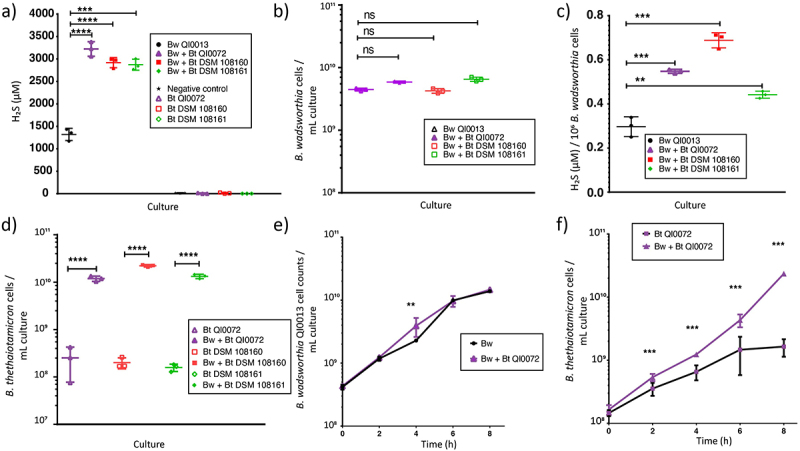
Co-culture of B. wadsworthia (Bw) QI0013 and B. thetaiotaomicron (Bt). a) H2S concentrations (µM) at 8 h of B. wadsworthia in monoculture or in co-culture with B. thetaiotaomicron QI0072, DSM 108160, and DSM 108161. b) Cell counts of B. wadsworthia at 8 h post-inoculation measured via qPCR. c) H2S concentration (µM) per 106 B. wadsworthia cells at 8 h. d) Cell counts of B. thetaiotaomicron at 8 h post-inoculation measured via qPCR. Each point represents a culture replicate (n = 7). In the negative control bacterial cells were not added. e-f) the cell numbers were tracked over time for the co-culture of B wadsworthia QI0013 and B. thetaiotaomicron QI0072. Horizontal lines represent average, and error bars represent SD. Results of unpaired t-tests are shown where **= p ≤ 0.01, ***= p ≤ 0.001, ****= p ≤ 0.0001.
