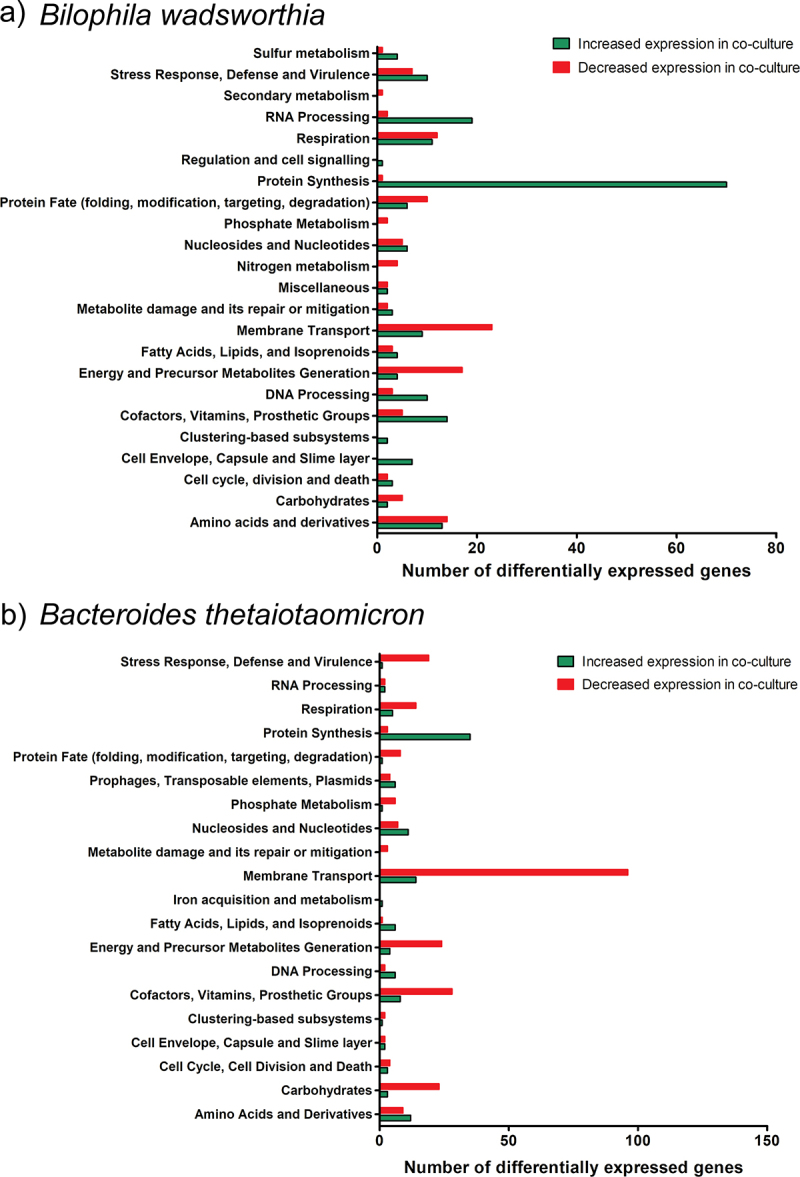
Figure 2.

Differentially expressed genes (DEGs) of B. wadsworthia and B. thetaiotaomicron in co-culture versus monoculture. a) DEGs in B. wadsworthia. b) DEGs in B. thetaiotaomicron. Bar charts show numbers of DEGs increased (green) and decreased (red) in expression in co-culture relative to the respective monoculture in each functional gene class as annotated in BV-BRC.
